In the fast-paced world of engineering, time is a precious commodity. Engineers spend countless hours generating reports – be it for Finite Element Analysis (FEA) results, Computational Fluid Dynamics (CFD) simulations, structural integrity assessments, or routine design reviews. This manual, repetitive task not only consumes valuable time but also introduces potential for human error. Enter report automation: a game-changer that streamlines your workflow, enhances accuracy, and frees up engineers to focus on more complex, value-added tasks.
This guide dives deep into the practicalities of engineering report automation, offering insights, strategies, and tools to help you implement robust automated reporting solutions for your projects, from aerospace components to oil & gas infrastructure.

Image courtesy of Wikimedia Commons.
The Imperative for Report Automation in Engineering
Why should you invest in automating your reporting processes? The benefits extend far beyond mere time-saving.
Why Automate? The Core Benefits
- Significant Time Savings: Reduce hours, even days, spent compiling data, generating plots, and formatting documents. This is especially critical for projects with tight deadlines or frequent iterations.
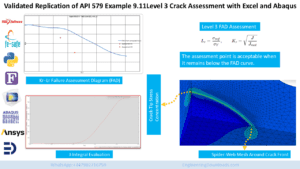
- Enhanced Accuracy and Consistency: Eliminate manual data entry errors and ensure all reports adhere to a consistent format and standard, crucial for regulatory compliance in fields like FFS Level 3 assessments.
- Improved Data Traceability: Automated systems can log data sources and processing steps, making it easier to track and audit information.
- Faster Decision-Making: Timely reports mean stakeholders get critical information quicker, enabling agile project management.
- Resource Optimization: Free up highly skilled engineers from mundane reporting tasks, allowing them to focus on analysis, innovation, and problem-solving.
- Scalability: Easily generate reports for a large number of simulations or design variations without a proportional increase in manual effort.
Common Challenges in Manual Reporting
Manual reporting, while familiar, comes with inherent drawbacks:
- Repetitive Strain: Copy-pasting, screenshotting, and data manipulation are monotonous and prone to error.
- Version Control Nightmares: Keeping track of report versions, especially when multiple engineers contribute, can be a headache.
- Inconsistent Formatting: Different engineers, different styles – leading to reports that lack a unified professional appearance.
- Data Discrepancies: Manual extraction or transcription can lead to numbers not matching source data.
- Lack of Reproducibility: Without clear automation, replicating a report’s generation process can be difficult, hindering future audits or updates.
Identifying Your Report Automation Needs
Before diving into tools, understand what you need to automate.
What Reports Can Be Automated?
Virtually any report with structured data can be automated. This includes:
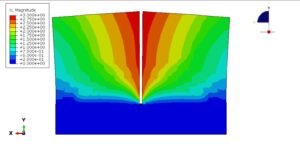
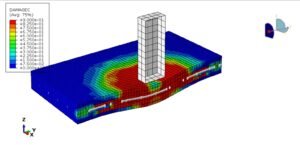
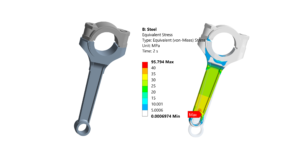
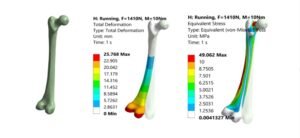
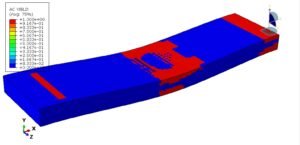
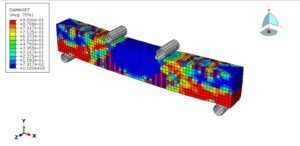
- FEA/CFD Simulation Summaries: Stress plots, displacement contours, pressure distributions, convergence histories, element quality checks, reaction forces, fatigue life predictions. Tools like Abaqus, ANSYS Mechanical, Fluent, CFX, and OpenFOAM are prime candidates for data extraction.
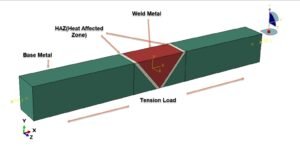
- Structural Integrity Reports: Summary of FFS Level 3 assessments, crack growth predictions, remaining life calculations.
- Material Test Reports: Stress-strain curves, yield strength, ultimate tensile strength, elongation data.
- CAD/CAE Design Reviews: Bill of Materials (BOM) generation, mass properties, interference checks, geometric dimensioning and tolerancing (GD&T) summaries from software like CATIA.
- Manufacturing Process Reports: Quality control data, process parameters, statistical process control (SPC) charts.
- Project Progress Reports: Key performance indicators (KPIs), budget tracking, timeline updates.
Data Sources: Where Does Your Information Live?
Identifying your data sources is the first step in designing your automation strategy.
- Simulation Result Files:
.odb(Abaqus),.rst(ANSYS),.dat,.out,.csv(OpenFOAM post-processing tools), HDF5 files. - CAD Models & Assemblies: Direct access via APIs (e.g., CATIA V5/3DEXPERIENCE automation, SolidWorks API).
- Test Data:
.csv,.txt, Excel spreadsheets, specialized lab software output. - Databases: SQL, NoSQL databases storing project data, material properties, or historical results.
- Other Documents: Word, PDF (though extracting from these can be more complex).
Key Technologies and Tools for Engineering Report Automation
A range of tools can power your report automation, from versatile scripting languages to specialized software APIs.
Scripting Languages: Python and MATLAB
These are the workhorses for custom automation, offering immense flexibility.
Python for Report Automation
Python is incredibly popular due to its readability, extensive libraries, and strong community support.
- Data Manipulation: Libraries like
pandasfor tabular data,NumPyfor numerical operations. - Plotting & Visualization:
Matplotlib,Seaborn,Plotlyfor professional-quality charts and graphs. - Report Generation:
python-docxfor Word documents.ReportLaborFpdifor PDF reports.Jinja2for HTML-based reports (often converted to PDF).
- Interfacing with CAE Software:
- Abaqus: Built-in Python scripting (Abaqus Scripting Interface) to control the CAE environment, extract ODB data.
- ANSYS: PyMAPDL for ANSYS Mechanical, PyFluent for ANSYS Fluent, or direct scripting within Workbench/ACT.
- OpenFOAM: Python scripts can parse output files, control
paraviewfor post-processing, or interact withOpenFOAM.orgutilities.
- File I/O: Built-in functions for reading/writing CSV, text, and binary files.
MATLAB for Report Automation
MATLAB excels in numerical computing and data visualization, particularly strong in academic and research settings.
- Data Analysis & Visualization: Powerful built-in functions for matrix operations, signal processing, and high-quality 2D/3D plotting.
- Report Generation:
MATLAB Report Generatortoolbox for creating professional reports in Word, PDF, HTML, or LaTeX.- Direct export of figures and tables.
- Interfacing with CAE Software:
- Many CAE tools offer MATLAB APIs or allow data export in formats easily readable by MATLAB.
- Specific toolboxes for data import (e.g., HDF5, CSV).
- Live Scripts: Allow combining code, output, and formatted text in an interactive document.
Commercial Software APIs and Integrations
Many high-end engineering software packages provide their own Application Programming Interfaces (APIs) or scripting capabilities:
- Abaqus Scripting Interface: A Python-based API for automating tasks within Abaqus CAE, including model creation, job submission, and results extraction from
.odbfiles. - ANSYS Workbench Scripting: Python or IronPython scripting to automate entire simulation workflows, parameter updates, and result extraction across various ANSYS products (Mechanical, Fluent, CFX).
- MSC Patran/Nastran: PCL (Patran Command Language) for automating pre/post-processing tasks.
- CATIA Automation: VBA or C++ APIs for scripting tasks, extracting design parameters, or generating BOMs.
General Automation Tools
- Excel Macros/VBA: Useful for automating tasks within Excel, especially for tabular data processing and simple report generation for less complex cases.
- Power Automate/Zapier: For integrating different cloud services and automating workflows, though less common for deep engineering data analysis.
Practical Workflow: Building Your First Automated Report
Let’s outline a generic, actionable workflow for creating an automated engineering report.
Step 1: Define Report Requirements and Structure
Before writing a single line of code, clearly define:
- Target Audience: Who will read this report? (e.g., management, fellow engineers, clients).
- Key Information: What absolutely must be in the report? (e.g., maximum stress, deformation, material properties, convergence plots).
- Desired Format: Word document, PDF, HTML, interactive dashboard?
- Visuals: What plots, images, or tables are needed?
- Layout: Headings, fonts, company branding, table of contents.
- Update Frequency: Daily, weekly, per simulation run?
Step 2: Data Extraction Strategy
This is where you pull the raw numbers and visuals.
From Simulation Results (e.g., FEA/CFD)
Use software-specific scripting:
- Abaqus: Write Python scripts to open
.odbfiles, query field outputs (e.g., stress, strain, displacement), extract history outputs (e.g., reaction forces, energy), and generate plots. - ANSYS Mechanical/Fluent/CFX: Utilize PyMAPDL/PyFluent, Workbench scripting, or result file readers to extract nodal/elemental data, surface integrals, or convergence plots.
- OpenFOAM: Use Python with libraries to parse
log.foamfor convergence, or scriptparaviewfor specific post-processing and screenshot generation.
From CAD Models (e.g., Bill of Materials)
Employ CAD software APIs:
- CATIA: Use VBA or Python (via COM automation) to access model properties, part lists, and generate BOMs.
- Other CAD: Similar APIs exist for SolidWorks, Inventor, etc., to extract geometric data, mass properties, or material assignments.
From Test Data (e.g., Material Testing)
Standard file parsing:
- Python/MATLAB: Use built-in functions (e.g.,
pandas.read_csv,readtable) to import data from.csv,.txt, or Excel files. - Excel/VBA: Macros can read and process data from various sheets or external files.
Step 3: Data Processing and Transformation
Raw data rarely goes directly into a report. You’ll need to:
- Filter and Aggregate: Extract maximum/minimum values, calculate averages, sum reactions.
- Perform Calculations: Apply safety factors, calculate margins, determine fatigue life based on extracted stress.
- Generate Visuals: Create publication-quality plots (stress contours, convergence graphs, scatter plots) using Matplotlib, MATLAB plotting functions, or direct screenshots from CAE software.
- Format for Presentation: Round numbers, convert units, prepare data for tables.
Step 4: Report Generation and Formatting
This is where the processed data takes its final shape.
- Python: Use
python-docxto insert text, tables, and images into a Word document. UseReportLaborFpdifor PDF generation, orJinja2with a templating engine to create HTML, then convert to PDF. - MATLAB: Utilize the
MATLAB Report Generatorto programmatically build reports with rich text, figures, and tables, controlling styling and layout. - LaTeX: For highly academic or mathematically intensive reports, Python or MATLAB can generate LaTeX source, which is then compiled to PDF.
Here’s a comparison of Python and MATLAB for report automation:
| Feature | Python for Automation | MATLAB for Automation |
|---|---|---|
| Ease of Learning | Relatively easy, especially for general scripting. | Intuitive for numerical tasks, syntax can be unique. |
| CAE Integration | Excellent (Abaqus, ANSYS via specific APIs/libraries). | Good, often via data export/import, or specific toolboxes. |
| Data Handling | pandas, NumPy are industry standard. |
Core strength with matrix operations, built-in functions. |
| Plotting Libraries | Matplotlib, Seaborn, Plotly (highly customizable). |
High-quality built-in plotting, MATLAB Report Generator. |
| Report Output | Word (python-docx), PDF (ReportLab), HTML, LaTeX. |
Word, PDF, HTML, LaTeX (via Report Generator). |
| Cost | Open-source (free). | Commercial license required (academic versions available). |
| Ecosystem | Vast, general-purpose programming. | Strong for scientific/engineering computation. |
Step 5: Distribution and Archiving
- Automatic Email: Use Python’s
smtplibor MATLAB’ssendmailfunction to email reports to stakeholders. - Network Drive Storage: Save reports to a designated project folder with appropriate naming conventions (e.g.,
ProjectX_Report_V1.2_YYYYMMDD.pdf). - Version Control: Integrate report generation into a version-controlled system (e.g., Git) to track changes in scripts and templates.
For complex setups, consider EngineeringDownloads.com’s downloadable Python scripts and MATLAB templates, or reach out for specialized online consultancy.
Verification and Sanity Checks for Automated Reports
Automation doesn’t mean you can ‘set it and forget it.’ Validation is paramount, especially in critical engineering applications like FFS Level 3 assessments.
Why Validation is Crucial
An automated report is only as good as the logic behind it. Errors in scripting, data parsing, or calculation can lead to misleading results and potentially catastrophic decisions. Always verify the output.
Key Verification Steps (Illustrative examples)
Spot Checks and Manual Review
- Initial Runs: For the first few automated reports, thoroughly compare them against manually generated reports or directly against source data.
- Critical Values: Manually verify a few key numbers: maximum stress (e.g., 250 MPa vs. 248 MPa from source), displacement (e.g., 5 mm vs. 4.9 mm), or reaction forces (e.g., 10 kN vs. 9.8 kN).
- Plot Accuracy: Visually inspect plots to ensure they correctly represent the data and match the corresponding plots from the simulation software.
Cross-Referencing with Source Data
- Direct Data Comparison: If your script extracts max principal stress, independently open the simulation results (e.g., Abaqus Viewer, ANSYS Post) and confirm the value shown matches the report.
- Unit Consistency: Double-check that all units are correctly handled and converted throughout the automation process.
Sensitivity Analysis (if applicable to report data)
- Input Variation: If the report relies on specific input parameters, slightly vary these inputs in a test case and verify that the report reflects a plausible change in output. For example, if increasing a load, ensure reported stress also increases.
Peer Review
- Have another engineer review your automation script and a sample report to catch any logic flaws or overlooked requirements.
Common Pitfalls and How to Avoid Them
Even with robust tools, challenges can arise. Anticipating these can save significant headaches.
Data Inconsistency
- Problem: Source data formats change, or units are inconsistent across different input files.
- Solution: Implement robust data validation checks within your scripts. Use clear error handling. Standardize input data formats wherever possible.
Over-Engineering the Solution
- Problem: Building an overly complex, generalized automation system for a simple, one-off report.
- Solution: Start small. Automate the most repetitive parts first. Iterate and expand functionality as needed. Don’t build a spaceship if a bicycle will do.
Lack of Version Control
- Problem: Scripts get modified, and it’s unclear which version generated a specific report.
- Solution: Use a version control system like Git for all your automation scripts and templates. Document changes thoroughly.
Ignoring User Feedback
- Problem: The automated report doesn’t meet the needs of the end-users (e.g., missing critical information, confusing layout).
- Solution: Involve stakeholders early and frequently. Gather feedback and be prepared to iterate on your report template and content.
Advanced Concepts and Future Trends
As your automation journey progresses, consider these advanced avenues.
Integrating with PLM/PDM Systems
Automate the direct upload of generated reports and data into Product Lifecycle Management (PLM) or Product Data Management (PDM) systems like Siemens Teamcenter or Dassault Systèmes ENOVIA. This ensures all project documentation is centralized and easily accessible.
AI and Machine Learning in Report Generation
While still emerging, AI could potentially:
- Summarize Findings: Automatically generate text summaries of key report findings.
- Identify Anomalies: Flag unusual data patterns or simulation results that might require further investigation.
- Predict Trends: Based on historical data, project future performance metrics for proactive decision-making.
Get Started with Report Automation Today!
Embracing report automation is not just about saving time; it’s about elevating your engineering practice. By implementing these strategies, you’ll produce more reliable, consistent, and professional reports, allowing you to focus on the challenging and rewarding aspects of engineering design and analysis. Check out EngineeringDownloads.com for more resources, including downloadable Python and MATLAB scripts to kickstart your report automation projects, or explore our online consultancy services for tailored solutions.