As engineers, we often design components to withstand static loads. But what happens when those loads are cyclic, repeatedly applied and removed over time? This is where material fatigue becomes a critical consideration. Fatigue failure, often occurring at stresses well below the material’s yield strength, can lead to catastrophic consequences if not properly accounted for.
Thankfully, modern engineering tools, particularly Finite Element Analysis (FEA), provide powerful capabilities for predicting fatigue life. This comprehensive guide will walk you through the practical aspects of performing fatigue analysis using FEA, offering actionable insights for both novice and experienced engineers.

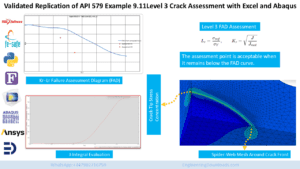
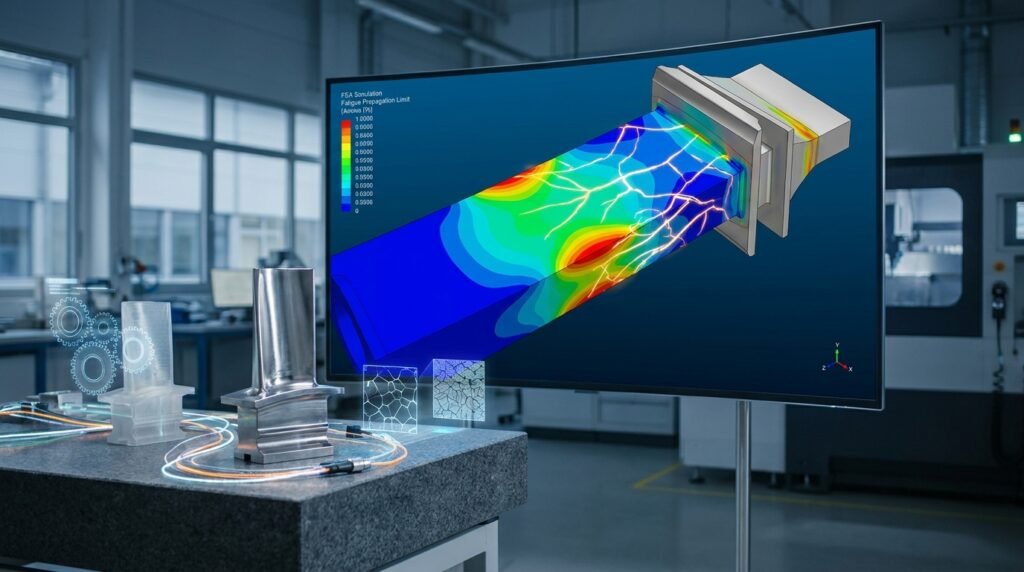
Image: An S-N curve illustrates the relationship between stress amplitude and fatigue life.
Understanding Material Fatigue: The Basics
Fatigue is a localized, progressive structural damage process that occurs when a material is subjected to cyclic loading. It typically initiates as a micro-crack, which then propagates under repeated stress cycles until the component can no longer sustain the applied load and fractures.
High-Cycle Fatigue (HCF) vs. Low-Cycle Fatigue (LCF)
- High-Cycle Fatigue (HCF): Occurs when materials are subjected to high numbers of cycles (typically > 10^5 cycles) at relatively low stress amplitudes, where deformation is predominantly elastic. S-N (Stress-Number of cycles) curves are commonly used for HCF analysis.
- Low-Cycle Fatigue (LCF): Involves fewer cycles (typically < 10^4 cycles) but higher stress amplitudes, often resulting in significant plastic deformation during each cycle. Strain-life curves (e.g., Coffin-Manson) are more appropriate for LCF.
Key Concepts in Fatigue Life Prediction
Before diving into FEA, it’s essential to grasp the fundamental concepts that govern fatigue behavior:
Stress Concentration
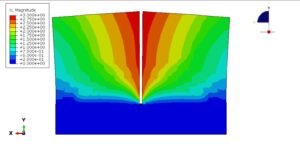
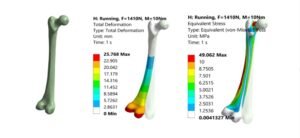
Geometric discontinuities (holes, fillets, notches) significantly amplify local stresses, creating ‘stress concentrations’. Fatigue cracks almost always initiate at these points. Accurate modeling of these features and fine meshing in these regions are crucial in FEA.
Mean Stress Effects
The average stress level in a cyclic load (mean stress) can significantly impact fatigue life. A tensile mean stress generally reduces fatigue life, while a compressive mean stress can extend it. Several theories account for this, including:
- Goodman Diagram: A widely used linear relationship for HCF, often conservative.
- Gerber Parabola: Provides a less conservative fit, often better for ductile materials.
- Soderberg Line: A very conservative linear relationship, typically used when safety is paramount.
Loading Type and Sequence
Fatigue can result from constant amplitude loading, where stress cycles are identical, or variable amplitude loading, which is more common in real-world applications (e.g., wind gusts on a bridge, engine vibrations). Variable amplitude loading requires damage accumulation theories like Miner’s Rule.
Surface Finish and Residual Stresses
The surface condition of a component greatly affects fatigue initiation. Rough surfaces provide more sites for cracks to start. Compressive residual stresses (often induced by shot peening or rolling) can significantly improve fatigue resistance, while tensile residual stresses are detrimental.
FEA for Fatigue Analysis: Advantages & Limitations
FEA is an indispensable tool for modern fatigue life prediction, especially for complex geometries and loading conditions where analytical methods fall short.
Why FEA is Powerful
- Complex Geometries: Easily handles intricate shapes and assemblies.
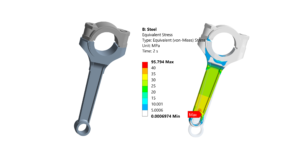
- Stress Distribution: Provides detailed stress and strain distributions throughout the component, pinpointing critical areas.
- Parametric Studies: Facilitates design optimization by quickly evaluating different geometries or material choices.
- Multiaxial Stresses: Can accurately capture and process multiaxial stress states, which are common in real-world scenarios.
Where FEA Needs Careful Handling
- Material Data Accuracy: FEA results are only as good as the input material fatigue data, which can be challenging to obtain accurately.
- Computational Cost: Detailed non-linear analysis for LCF can be computationally expensive.
- Modeling Assumptions: Simplifying assumptions (e.g., ideal material behavior, perfect bonding) can impact accuracy.
- Experience Required: Proper meshing, boundary conditions, and interpretation of results demand engineering expertise.
Practical Workflow for FEA Fatigue Analysis
Performing a reliable fatigue analysis using FEA involves a systematic approach. Here’s a step-by-step workflow:
Step 1: Geometry Preparation
Begin by simplifying your CAD model. Remove small features (chamfers, small fillets, holes for fasteners not critical to the fatigue path) that don’t significantly affect overall stress distribution but increase mesh complexity. However, ensure that stress concentration features where fatigue is expected are retained and accurately represented.
Step 2: Material Properties Definition
This is arguably the most critical step. You’ll need:
- Elastic Properties: Young’s Modulus, Poisson’s Ratio.
- Yield Strength and Ultimate Tensile Strength: For mean stress corrections.
- Fatigue Properties: S-N curves (stress amplitude vs. cycles to failure) for HCF, or strain-life curves (e.g., Basquin and Coffin-Manson parameters) for LCF. These are typically derived from experimental data.
Step 3: Meshing Strategies
Meshing is paramount. Use:
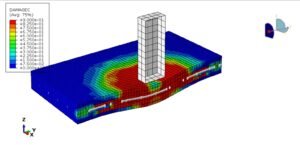
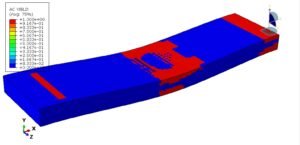
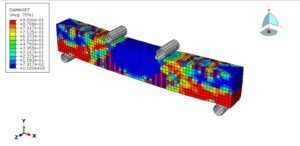
- Fine Mesh: In critical areas with high stress gradients or stress concentrations (e.g., fillets, holes, weld toes).
- Appropriate Element Type: Solid elements (tetrahedrons or bricks) are common for 3D parts. Shell elements can be used for thin-walled structures, but be mindful of through-thickness stress gradients.
- Element Order: Higher-order elements (quadratic) capture stress gradients more accurately than linear elements.
Step 4: Boundary Conditions & Loads
Apply realistic loads and boundary conditions that accurately represent the component’s operational environment.
- Loading Cycles: Define the load history – constant amplitude, variable amplitude (load spectrum), or transient loads.
- Constraints: Apply fixed supports, symmetry conditions, or contact definitions accurately.
- Temperature Effects: Consider if high temperatures or thermal cycling are relevant, as they can alter material properties.
Step 5: Static or Transient Stress Analysis
First, perform a stress analysis to get the stress/strain fields.
- Linear Static Analysis: Often sufficient for HCF where stresses remain elastic.
- Non-Linear Analysis: Required for LCF or if significant plastic deformation occurs, or if contact, large deflections, or material non-linearity (plasticity) are present.
Step 6: Fatigue Post-Processing
Once stress/strain results are obtained, a dedicated fatigue module (available in most commercial FEA software) will perform the life calculations:
- Stress/Strain History: Extract the time-history of stress or strain at critical locations.
- Fatigue Criterion: Apply an appropriate fatigue criterion (e.g., SWT, Fatemi-Socie for multiaxial).
- Mean Stress Correction: Apply Goodman, Gerber, or another suitable correction if mean stresses are present.
- Damage Accumulation: For variable amplitude loading, apply Miner’s Rule (or a similar method) to sum damage from different load blocks.
- Results: Output typically includes fatigue life (number of cycles), damage factor, and factor of safety against fatigue.
Common Software Tools
- ANSYS Mechanical: Features robust fatigue modules, including nCode DesignLife integration.
- Abaqus: Offers explicit and implicit solvers for complex non-linear fatigue problems, with external fatigue life prediction tools often used for post-processing.
- MSC Patran/Nastran: Powerful for HCF, particularly in aerospace and automotive applications.
- Open-Source Tools: While not having integrated fatigue modules, stress/strain results from tools like OpenFOAM can be exported and processed using Python or MATLAB scripts for custom fatigue calculations.
Verification & Sanity Checks in Fatigue FEA
No FEA result should be accepted without thorough verification. This is especially true for fatigue, where the consequences of error can be severe.
Mesh Sensitivity Study
Always perform a mesh sensitivity study in critical areas. Ensure that further mesh refinement does not significantly change the stress or fatigue life results, indicating mesh independence.
Boundary Condition Influence
Test the sensitivity of your results to slight variations in boundary conditions. Are the constraints overly rigid or too flexible? How do small changes affect stress concentrations?
Convergence Criteria
For non-linear analyses, ensure that solution convergence criteria (e.g., force, displacement residuals) are met. Lack of convergence often indicates a modeling issue.
Stress Concentration Factor Validation
For simple geometries, compare calculated stress concentration factors from FEA with theoretical or empirical solutions available in literature (e.g., Roark’s Formulas for Stress and Strain). This builds confidence in your model’s ability to capture local stress peaks.
Comparison with Hand Calculations/Empirical Data
Wherever possible, simplify the problem to a point where hand calculations or existing empirical data can provide a benchmark. This is a powerful sanity check for the overall methodology.
Sensitivity to Material Properties
Fatigue life is extremely sensitive to material fatigue properties. Conduct a sensitivity analysis by varying input material parameters within their known uncertainty ranges. This helps understand the robustness of your design.
Advanced Topics & Considerations
Multiaxial Fatigue
When stresses are not purely uniaxial (e.g., combined tension and torsion), multiaxial fatigue theories are needed. These typically involve calculating an equivalent uniaxial stress or strain range for comparison with uniaxial fatigue data.
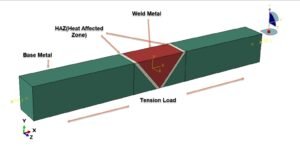
Welded Joint Fatigue
Welded structures present unique challenges due to geometric discontinuities, residual stresses, and material property variations in the weld zone. Specialized approaches like structural hot-spot stress method or notch stress intensity methods are often employed.
Probabilistic Fatigue
Fatigue is inherently statistical. Probabilistic fatigue methods account for uncertainties in material properties, loading, and geometry to provide reliability-based life predictions, often using Monte Carlo simulations.
For engineers diving into these advanced areas, downloadable Python or MATLAB scripts from EngineeringDownloads.com can be invaluable for automating complex post-processing and probabilistic analyses.
Common Mistakes to Avoid
Even experienced engineers can fall into common traps when performing fatigue FEA:
- Inaccurate Material Data: Using generic or literature-derived S-N curves without understanding their limitations for your specific material and processing.
- Insufficient Mesh Resolution: Not refining the mesh enough in critical stress concentration regions, leading to underestimated peak stresses and overestimated life.
- Ignoring Mean Stress Effects: Failing to account for tensile mean stresses can lead to unsafe life predictions.
- Over-simplifying Load Spectra: Using constant amplitude loading when the real-world load is highly variable.
- Not Validating Results: Relying solely on FEA outputs without cross-checking against simpler models, test data, or engineering judgment.
- Misinterpreting Factor of Safety: A high factor of safety against yielding doesn’t automatically mean a high factor of safety against fatigue.
Checklist for Successful Fatigue FEA
Use this checklist to ensure you’ve covered all critical aspects of your fatigue analysis project:
| Task Category | Action Item | Status |
|---|---|---|
| Pre-Processing | Geometry simplified appropriately (critical features retained) | ☐ |
| Accurate material properties (elastic, yield, ultimate, fatigue data) | ☐ | |
| Mesh refined in critical regions (stress concentrations) | ☐ | |
| Element type and order appropriate for analysis | ☐ | |
| Boundary conditions and loads represent real-world scenario | ☐ | |
| Analysis Execution | Correct analysis type chosen (linear static, non-linear, transient) | ☐ |
| Solution convergence achieved (for non-linear) | ☐ | |
| Post-Processing | Appropriate fatigue criterion selected | ☐ |
| Mean stress correction applied (if needed) | ☐ | |
| Damage accumulation considered for variable amplitude loading | ☐ | |
| Verification & Validation | Mesh sensitivity study performed | ☐ |
| Results compared with hand calculations/empirical data (if applicable) | ☐ | |
| Sensitivity to material properties checked | ☐ | |
| Engineering judgment applied to interpret results | ☐ |
Further Reading
For more in-depth technical details on fatigue analysis principles, consult reputable standards organizations like NAFEMS or ASTM. For example, refer to the ASTM Committee E08 on Fatigue and Fracture for relevant standards and publications.
Conclusion
Fatigue life prediction using FEA is a powerful technique for ensuring the durability and reliability of engineering components. By diligently following a structured workflow, paying close attention to material data, meshing, and boundary conditions, and rigorously verifying your results, you can confidently design structures that withstand the rigors of cyclic loading. Embrace the power of FEA, but always temper it with sound engineering principles and critical thinking.