Introduction to Advanced Fatigue Analysis
In structural engineering, components are rarely subjected to static loads alone. More often, they endure repeated or cyclic loading, which can lead to fatigue failure. Unlike static failure, fatigue can occur at stresses significantly below the material’s yield strength, making it a critical consideration for designs in aerospace, oil & gas, automotive, and civil infrastructure.
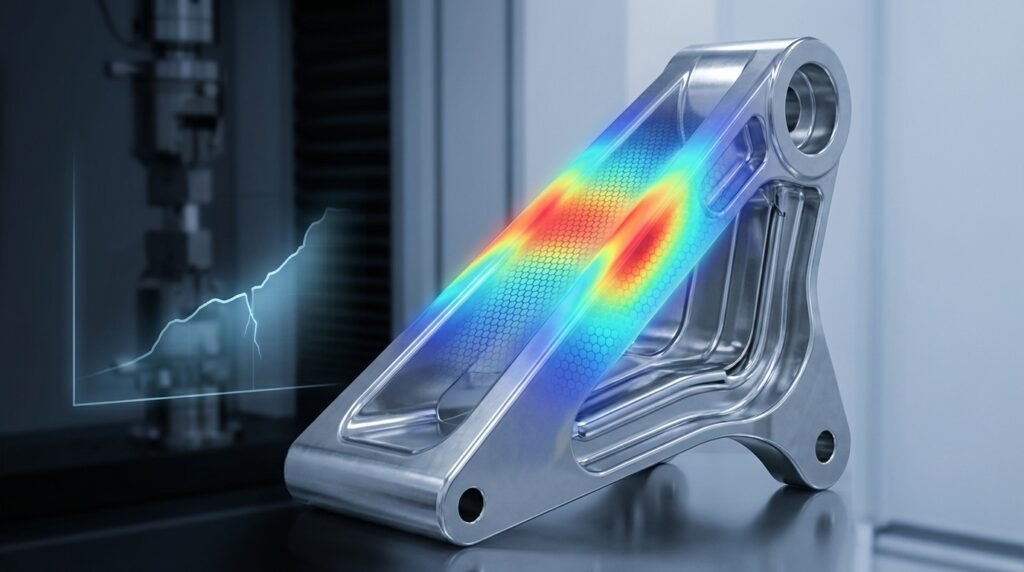
Understanding and accurately predicting fatigue life is paramount to ensuring structural integrity and preventing catastrophic failures. Advanced fatigue analysis, often utilizing Finite Element Analysis (FEA), provides engineers with powerful tools to assess the durability of components under complex loading conditions, optimize designs, and extend service life.

Image: Illustrative S-N (Stress-Life) curve demonstrating the relationship between stress amplitude and the number of cycles to failure for a material.
Understanding Fatigue Failure Mechanisms
Fatigue failure is a progressive, localized structural damage process that occurs when a material is subjected to cyclic loading. It typically involves three stages: crack initiation, crack propagation, and final fracture.
Key Concepts in Fatigue
To accurately perform fatigue analysis, engineers must grasp several fundamental concepts and methodologies.
S-N Curves (Stress-Life Approach)
The Stress-Life (S-N) approach is widely used for high-cycle fatigue (HCF), where loads are predominantly elastic. An S-N curve plots stress amplitude (S) against the number of cycles to failure (N) on a log-log scale. For some materials (e.g., steels), an “endurance limit” or “fatigue limit” exists, below which fatigue theoretically will not occur.
- Application: HCF, high number of cycles, nominal stresses below yield.
- Limitations: Does not account for plastic deformation or local yielding accurately. Sensitive to surface finish, mean stress, and environmental factors.
E-N Curves (Strain-Life Approach)
The Strain-Life (E-N) approach is more suitable for low-cycle fatigue (LCF), where significant plastic deformation occurs locally. It relates plastic and elastic strain amplitude to cycles to failure. This method provides a more accurate representation for components experiencing cyclic plastic deformation at stress concentrations.
- Application: LCF, low number of cycles, significant local plasticity.
- Data Requirement: Requires cyclic stress-strain data, more complex to obtain.
Fracture Mechanics Approach (Crack Growth)
When a crack is already present, or initiates early in life, linear elastic fracture mechanics (LEFM) can be used to predict the remaining fatigue life. Paris’s Law (da/dN = C (ΔK)^m) is a classic example, relating the crack growth rate (da/dN) to the stress intensity factor range (ΔK). This approach is critical in structural integrity assessments, especially for Fitness-for-Service (FFS) Level 3 evaluations in industries like Oil & Gas and Aerospace.
Mean Stress Effects & Correction Theories
The presence of a non-zero mean stress (average stress over a cycle) significantly influences fatigue life. Compressive mean stresses are generally beneficial, while tensile mean stresses are detrimental. Common correction theories include:
- Goodman Diagram: A widely used linear relationship to account for mean stress effects.
- Soderberg Diagram: More conservative, uses yield strength as a reference.
- Gerber Parabola: Provides a less conservative, parabolic fit for mean stress correction.
Practical Workflow for Advanced Fatigue Analysis
Conducting a reliable fatigue analysis typically follows a structured process, often involving powerful FEA software like Abaqus, ANSYS Mechanical, or specialized tools like MSC Patran/Nastran.
Step-by-Step Guide
1. Material Characterization
Accurate material properties are the bedrock of any fatigue analysis. This includes:
- S-N or E-N Data: Experimentally derived curves specific to the material and environmental conditions.
- Cyclic Stress-Strain Curve: For LCF analysis.
- Fatigue Strength Coefficient and Exponent: From E-N data.
- Fracture Toughness (KIC): For fracture mechanics approaches.
- Surface Finish Factor: Accounts for surface quality.
Always source data from reliable standards (e.g., ASTM) or material handbooks. Be cautious with generic data, as processing history can significantly alter fatigue performance.
2. Load Spectrum Definition
The most challenging aspect is often defining the real-world load history. This involves:
- Identifying Critical Load Cases: Operating, startup, shutdown, environmental loads.
- Time History Data: Acquiring experimental load time series if possible.
- Cycle Counting: Using algorithms like Rainflow Counting to convert irregular load histories into a series of equivalent constant amplitude cycles. This is crucial for applying cumulative damage rules.
- Block Loading: Simplifying complex histories into blocks of constant amplitude cycles.
3. Finite Element Model Setup
The quality of your FE model directly impacts the accuracy of your fatigue results.
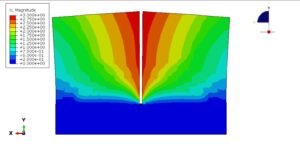
- Geometry Preparation: Simplify non-critical features, but retain all stress concentrations (fillets, holes, notches) accurately.
- Meshing:
- Global Mesh: Use a coarser mesh for regions away from critical areas.
- Local Refinement: Crucially, apply fine, high-quality meshes (e.g., hexahedral elements where possible, or well-shaped tetrahedral) at stress concentration points where fatigue cracks are likely to initiate. Consider a minimum of 3-5 elements across critical thickness.
- Element Type: Use quadratic elements (e.g., 8-node brick or 10-node tetrahedron) for better stress approximation.
- Boundary Conditions & Loading: Apply realistic constraints and forces/pressures that accurately represent the operational environment. Ensure static equilibrium.
- Stress Linearization: For pressure vessels, this method can help separate membrane, bending, and peak stresses at discontinuity regions.
4. Fatigue Analysis Execution
Once the FE model is set up and stress results obtained, the fatigue solver takes over.
- Software Integration: Modern FEA packages often have integrated fatigue modules (e.g., Abaqus/fe-safe, ANSYS Workbench Fatigue Tool) that directly use stress/strain results from the structural analysis.
- Choosing the Fatigue Model: Select S-N, E-N, or fracture mechanics based on material behavior, loading regime (HCF/LCF), and design intent.
- Mean Stress Correction: Apply the chosen mean stress correction theory (Goodman, Soderberg, etc.).
- Cumulative Damage: For variable amplitude loading, Miner’s Rule (linear damage accumulation) is commonly employed to sum damage from different load cycles.
5. Post-Processing and Life Prediction
Interpreting the results is as vital as the analysis itself.
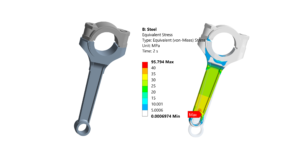
- Fatigue Life Contours: Visualize regions of lowest predicted life, indicating critical areas.
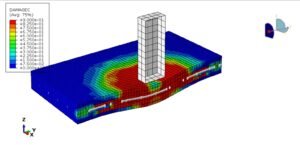
- Damage Factor: A value representing the fraction of life consumed. A damage factor of 1 indicates failure.
- Factor of Safety (FoS): Often calculated on life or stress. A FoS of 2 on life means the component is expected to last twice its design life.
Comparison of Fatigue Life Prediction Methods
| Method | Primary Application | Key Input Data | Advantages | Limitations |
|---|---|---|---|---|
| Stress-Life (S-N) | High-Cycle Fatigue (HCF) | S-N curve, Material ultimate strength | Simple, widely used, good for elastic stresses | Poor for local plasticity, sensitive to surface finish |
| Strain-Life (E-N) | Low-Cycle Fatigue (LCF) | Cyclic stress-strain curve, E-N curve | Accounts for local plasticity, more accurate for LCF | Requires more complex material data, typically for ductile materials |
| Linear Elastic Fracture Mechanics (LEFM) | Crack Growth Prediction (FFS) | Paris Law constants, Crack geometry, KIC | Predicts remaining life with existing flaws, quantitative | Assumes pre-existing crack, limited for small cracks, brittle fracture |
Verification & Sanity Checks in Fatigue Analysis
Rigorous verification and validation are non-negotiable for producing reliable fatigue analysis results. Never blindly trust software output.
Essential Checks
Mesh Sensitivity Analysis
Perform several analyses with increasingly refined meshes at critical stress concentration points. The results (e.g., maximum principal stress, stress intensity factor) should converge to a stable value. If results change significantly with further refinement, your mesh is still too coarse.
Boundary Condition & Load Application Review
Double-check that all supports, restraints, and applied loads are realistic and correctly defined. Incorrect boundary conditions are a leading cause of erroneous FEA results. Ensure your loading spectrum matches actual operational conditions as closely as possible.
Material Property Validation
Verify that the S-N, E-N, or fracture mechanics data used corresponds to the actual material, temperature, and environmental conditions. Small errors in material data can lead to large discrepancies in predicted fatigue life.
Stress Concentration Factor (SCF) Checks
For simple geometries with known stress concentration factors (e.g., holes in plates, fillets), compare your FEA-derived SCFs with published theoretical values. This provides a quick sanity check on your model’s ability to capture stress raisers.
Convergence Criteria (for Solvers)
Ensure that your FEA solver has converged adequately. If an iterative solver fails to converge or exhibits poor convergence, the stress results may be inaccurate, which will directly impact fatigue life predictions.
Sensitivity Analysis
Investigate how changes in key input parameters (e.g., load amplitude variation, material property scatter, temperature changes) affect the predicted fatigue life. This helps understand the robustness of your design and identify critical parameters that need tighter control.
Comparison with Hand Calculations or Prior Data
For simplified cases or analogous components, perform hand calculations or compare your FEA results with historical data or field performance. Even a basic calculation can highlight gross errors in your advanced analysis.
Common Mistakes and How to Avoid Them
- Ignoring Mean Stress Effects: Always consider mean stress effects, especially for tensile mean stresses.
- Poor Mesh Quality at Hot Spots: Inadequate mesh density or poor element quality at stress concentrations will produce inaccurate peak stresses and thus incorrect fatigue life.
- Incorrect Material Data: Using generic or inappropriate S-N/E-N curves for the specific material, processing, and environment can lead to significant errors.
- Unrealistic Load Definition: Over-simplifying load spectra or missing critical load events leads to non-conservative life predictions.
- Extrapolating S-N Curves: Extending S-N curves beyond the range of experimental data, especially for HCF, can be highly unreliable.
- Not Accounting for Surface Finish: Surface roughness, residual stresses from manufacturing, and surface treatments significantly impact fatigue strength.
Tips for Robust Fatigue Design
- Design for Smooth Transitions: Avoid sharp corners and sudden changes in cross-section. Use generous fillets and radii to minimize stress concentrations.
- Consider Surface Treatments: Shot peening, case hardening, and nitriding can induce beneficial compressive residual stresses, improving fatigue resistance.
- Material Selection: Choose materials with known good fatigue properties, especially high endurance limits if applicable.
- Redundant Load Paths: Where possible, design with redundant components or load paths so that the failure of one element does not lead to catastrophic failure of the entire structure.
- Quality Control: Implement strict manufacturing quality control to minimize defects, surface flaws, and welding imperfections that can act as crack initiation sites.
Troubleshooting Common Fatigue Analysis Issues
- Unrealistically High Stresses: Check boundary conditions, load application, and mesh quality at stress concentration points. Are you modeling a singularity?
- Convergence Failures: Often indicates numerical instability. Review material properties, contact definitions (if any), and time stepping/incrementation settings.
- Unexpectedly Low/High Life Predictions: Re-examine material data, mean stress correction, and load spectrum. Verify that the stress results are reasonable by hand calculations for simpler cases.
- Negative Fatigue Life: This is a clear indicator of an error, often related to incorrect material properties or extremely high stresses that are physically implausible.
Enhance Your Fatigue Analysis Skills
Mastering advanced fatigue analysis requires continuous learning and practical application. If you’re looking to deepen your expertise in FEA for structural integrity, EngineeringDownloads.com offers a range of online/live courses, internship-style training, and project/contract consultancy, alongside affordable HPC rental to run complex models.
Frequently Asked Questions (FAQ)
Further Reading
For more in-depth information on fatigue analysis and material behavior, consult authoritative sources such as the ASTM E606/E606M – 20 Standard Test Method for Strain-Controlled Fatigue Testing.