In the world of engineering, data is king. From material properties and sensor readings to finite element analysis (FEA) results and computational fluid dynamics (CFD) outputs, we constantly work with vast datasets. But simply looking at an average or a standard deviation might not tell the whole story. Enter skewness – a critical statistical measure that reveals the asymmetry of your data distribution.
Understanding skewness is not just an academic exercise; it’s a practical necessity for making informed engineering decisions. Whether you’re designing a structure, optimizing a fluid flow, or performing structural integrity assessments, ignoring skewness can lead to flawed assumptions, inaccurate predictions, and potentially costly errors.

Image courtesy of Skbkekas (CC BY-SA 3.0 via Wikimedia Commons)
What is Skewness? A Practical Definition
In simple terms, skewness is a measure of the asymmetry of the probability distribution of a real-valued random variable about its mean. A distribution or dataset is skewed if it is not symmetric, meaning one tail is longer than the other.
Types of Skewness
- Positive Skewness (Right-Skewed): The tail on the right side of the distribution is longer or fatter than the tail on the left side. This means the majority of the data points are concentrated on the left, and the mean is typically greater than the median. Think of component failure times, where most fail early, but a few last exceptionally long.
- Negative Skewness (Left-Skewed): The tail on the left side of the distribution is longer or fatter than the tail on the right side. Here, most data points are concentrated on the right, and the mean is typically less than the median. An example might be exam scores, where most students score high, but a few perform poorly.
- Zero Skewness (Symmetric): The distribution is perfectly symmetrical, like a normal (Gaussian) distribution. In this case, the mean, median, and mode are all equal (or very close).
Visualizing Skewness
The easiest way to spot skewness is by plotting your data using a histogram or a kernel density plot. A quick glance can often reveal whether the bulk of your data lies to one side, with a stretched ‘tail’ pointing to the other.
Why Skewness Matters in Engineering Analysis
Many statistical methods and engineering analyses assume that your data is normally distributed (symmetrical). When data is skewed, these assumptions are violated, leading to potentially misleading conclusions.
Impacts Across Engineering Disciplines:
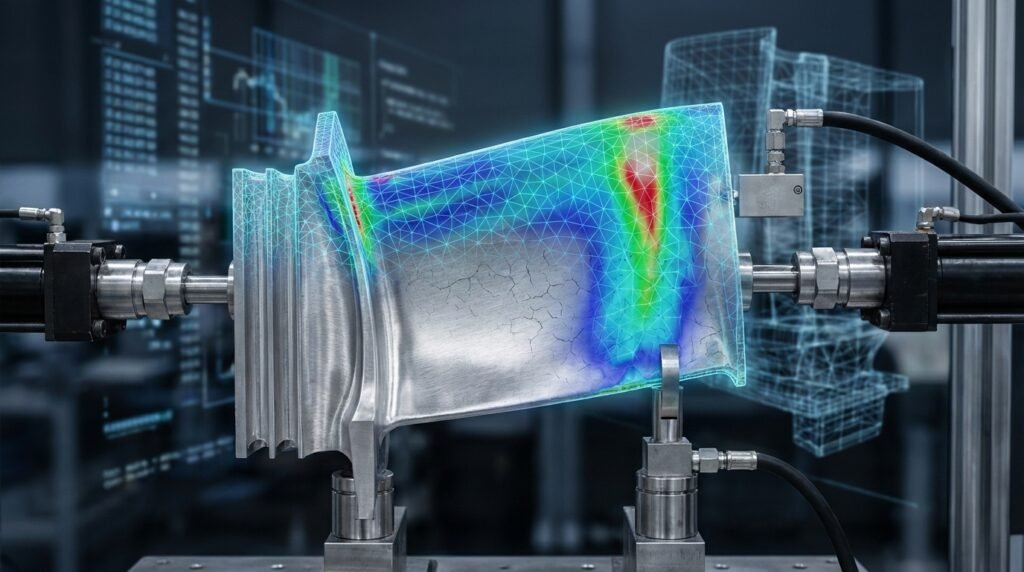
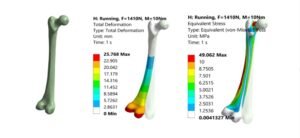
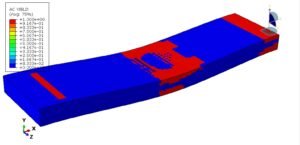
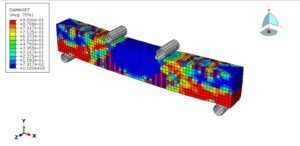
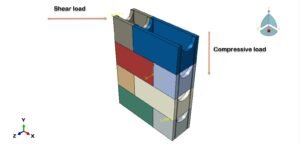
- Structural Engineering/FEA: Material properties (e.g., yield strength, fatigue life) often exhibit skewness. If your analysis assumes a normal distribution for these properties when they are positively skewed, you might overestimate component life or safety factors. Conversely, negative skewness could lead to underestimation. In mesh quality, high element skewness can severely impact solution accuracy and convergence.
- CFD/Fluid Dynamics: Velocity profiles, pressure distributions, or turbulence characteristics in complex flows can be highly skewed. Assuming symmetry might misrepresent critical flow features, impacting design decisions for aerospace components, oil & gas pipelines, or biomechanics devices.
- Reliability & FFS (Fitness-for-Service): Predicting component failure or remaining life often relies on statistical models. Skewed failure time data (e.g., from accelerated life testing) requires specific statistical treatments to avoid inaccurate reliability predictions.
- Design & Optimization: Performance metrics, sensor readings, or manufacturing tolerances can show skewness. Understanding this helps in setting more realistic design bounds and optimizing processes effectively.
Measuring Skewness: Key Coefficients
While visual inspection is helpful, quantitative measures are essential. The most common is the Fisher-Pearson coefficient of skewness.
Common Skewness Coefficients:
- Pearson’s First Coefficient of Skewness:
(Mean - Mode) / Standard Deviation - Pearson’s Second Coefficient of Skewness:
3 * (Mean - Median) / Standard Deviation(Often preferred when the mode is ill-defined). - Fisher-Pearson Coefficient of Skewness: This is the most widely used and is based on the third standardized moment of the distribution. Statistical software like Python’s SciPy library (
scipy.stats.skew) or MATLAB’sskewnessfunction typically calculate this coefficient.
Interpreting the coefficient: A value of 0 indicates perfect symmetry. Positive values indicate positive skewness, and negative values indicate negative skewness. The larger the absolute value, the greater the skewness.
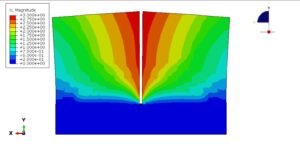
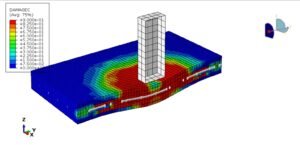
Skewness in FEA & CFD Workflows: Mesh Quality
Beyond data distribution, the term ‘skewness’ has a specific, crucial meaning in simulation meshing, particularly in tools like Abaqus, ANSYS Mechanical, Fluent, CFX, and OpenFOAM.
Mesh Element Skewness
In meshing, element skewness is a measure of how far an element’s shape deviates from its ideal (equilateral or equiangular) shape. It directly impacts the accuracy, stability, and convergence of your finite element or finite volume solution.
High element skewness can cause:
- Reduced accuracy due to poor approximation of gradients.
- Slower convergence or divergence of the solver.
- Spurious results or oscillations.
- Difficulty in achieving solution stability.
Acceptable Skewness Values for Mesh Elements:
While specific thresholds vary by solver and element type, here’s a general guide:
| Skewness Value | Quality Interpretation | Impact on Simulation |
|---|---|---|
| 0.0 – 0.25 | Excellent | Very good solution accuracy and convergence. |
| 0.25 – 0.50 | Good | Generally acceptable for most analyses. |
| 0.50 – 0.75 | Fair/Poor | May lead to accuracy issues, require more iterations, or slow convergence. |
| 0.75 – 0.95 | Bad | Likely to cause significant accuracy loss, divergence, or instability. Avoid if possible. |
| > 0.95 | Unacceptable | Almost certain to cause solver failure or highly inaccurate results. Must be addressed. |
Note: These are general guidelines. Always consult your specific solver’s documentation (e.g., Abaqus Quality Criteria, ANSYS Meshing help) for precise recommendations.
Practical Workflow: Addressing Skewness in Engineering
Managing skewness involves different strategies depending on whether you’re dealing with raw data distributions or mesh element quality.
1. Addressing Skewness in Data Distributions (e.g., Material Properties, Sensor Data)
- Visualize Your Data: Start with histograms and Q-Q plots. Tools like Python (Matplotlib, Seaborn) or MATLAB are excellent for this. This quickly reveals the distribution’s shape and any asymmetry.
- Quantify Skewness: Calculate the Fisher-Pearson coefficient using statistical software. This gives you a numerical value for comparison.
- Understand the Implications: How does the skewness affect your assumptions? If your analysis relies on normality, significant skewness means your results might be biased.
- Consider Data Transformations (Use with Caution):
- Log Transformation: Often used for positively skewed data. If
Xis your data, transform it tolog(X). - Square Root Transformation: Another option for positive skewness:
sqrt(X). - Reciprocal Transformation: For highly skewed data,
1/Xmight be considered.
Important Note: Transformations change the nature of your data and can make interpretation more complex. Always apply them carefully and understand their impact on your physical interpretation. Results from transformed data often need to be back-transformed to be physically meaningful. For complex scenarios, consider consulting statistical experts or advanced tutorials available on EngineeringDownloads.com.
- Log Transformation: Often used for positively skewed data. If
- Use Non-Parametric Methods: If transformations are unsuitable, consider statistical methods that do not assume normality (e.g., Mood’s median test instead of t-test).
2. Addressing Skewness in Simulation Meshes (FEA/CFD)
- Define Quality Criteria: Before meshing, set acceptable mesh quality metrics (including skewness) based on your solver’s recommendations and the physics of your problem.
- Generate Initial Mesh: Use your preferred meshing software (e.g., Abaqus/CAE, ANSYS Meshing, HyperMesh, ICEM CFD, Salome, OpenFOAM’s
snappyHexMesh). - Inspect Mesh Quality Report: All professional meshing tools provide detailed reports on element quality. Pay close attention to the maximum skewness values and the number of elements exceeding acceptable thresholds.
- Identify & Isolate Problematic Regions: Most tools allow you to visualize elements with poor quality. Pinpoint these areas, often at complex geometries, fillets, or boundary layer regions.
- Remesh or Refine Locally:
- Local Refinement: Apply smaller element sizes in problematic areas.
- Mesh Smoothing: Algorithms that adjust node positions to improve element shape without changing topology.
- Re-topologize: In complex geometries, sometimes the underlying CAD needs simplification or modification to allow for better meshing.
- Change Element Type: In some cases, switching from hexahedral to tetrahedral elements (or vice versa with careful consideration) might resolve local skewness issues.
- Structured Meshing: For simple geometries, structured hex meshes often yield excellent quality.
- Iterate and Verify: Regenerate the mesh, re-check the quality report, and repeat until element skewness meets your criteria.
Verification & Sanity Checks for Skewness
Always double-check your work, whether you’re transforming data or improving mesh quality.
- For Data: After any transformation, re-plot your histogram and recalculate the skewness coefficient. Has the distribution become more symmetric? Does the transformed data still make physical sense?
- For Meshes: Run a small pilot simulation or a static check with your improved mesh. Compare initial convergence behavior and solution stability with the poorly skewed mesh. Does the solution appear more reasonable and stable?
- Sensitivity Studies: Perform analyses with varying levels of skewness (if applicable to your data) or mesh quality. How sensitive are your critical results (e.g., stress, temperature, velocity) to changes in skewness?
- Compare with Benchmarks: If possible, compare your results to analytical solutions, experimental data, or trusted benchmarks to validate the impact of addressing skewness.
Common Mistakes & Troubleshooting
- Ignoring Skewness Entirely: The most common mistake. This can lead to non-conservative designs or inaccurate predictions.
- Blindly Applying Transformations: Transformations should be applied judiciously, with an understanding of their mathematical and physical implications.
- Over-meshing: Trying to achieve excessively low skewness everywhere can lead to unnecessarily large models and long computational times. Focus on critical regions.
- Under-meshing: Not addressing high skewness in critical areas, leading to inaccurate results, especially in areas of high gradients (e.g., stress concentrations, boundary layers).
- Misinterpreting Skewed Results: For instance, simply using the mean of a highly skewed distribution without considering the median or mode can be highly misleading. Always report appropriate summary statistics.
Conclusion
Skewness is more than just a statistical curiosity; it’s a fundamental characteristic of data and mesh elements that profoundly impacts the reliability and accuracy of engineering analyses. By understanding its nature, recognizing its presence through visualization and quantification, and applying appropriate strategies – whether data transformations or mesh refinement techniques – engineers can significantly improve the quality and trustworthiness of their work.
Embracing these best practices in your CAD-CAE workflows, Python or MATLAB automation scripts for data analysis, and general engineering problem-solving will lead to more robust designs and more confident decision-making.
If you’re looking for advanced Python or MATLAB scripts to automate skewness analysis or need expert guidance on mesh quality in your Abaqus or ANSYS projects, consider exploring the specialized resources and online consultancy options available through EngineeringDownloads.com.
Further Reading
For more detailed mathematical derivations of skewness coefficients, you can consult authoritative statistical resources like Wikipedia’s Skewness article.