Demystifying Skewness: A Practical Guide for Engineers
As engineers, we constantly work with data – from sensor readings and material test results to complex simulation outputs. Understanding the distribution of this data is crucial for making informed decisions. One key statistical measure that often gets overlooked, but holds significant practical implications, is skewness.
Skewness tells us about the asymmetry of a probability distribution. In simpler terms, it indicates whether the data points are concentrated more on one side of the mean than the other. Ignoring skewness can lead to incorrect conclusions about average performance, risk, and even system reliability.

Comparison of different types of skewness. Image by Skbkekas, via Wikimedia Commons.
What Exactly is Skewness?
At its core, skewness is a measure of the asymmetry of the probability distribution of a real-valued random variable about its mean. A distribution is symmetric if it looks the same on both sides of its center. Skewness quantifies the extent to which a distribution deviates from this symmetry.
Think of a histogram of your data:
- If the histogram looks roughly mirrored on both sides of its peak, it’s symmetrical (or very close to it).
- If one tail of the distribution is longer than the other, the distribution is skewed.
Understanding this asymmetry helps engineers characterize variations in crucial parameters, predict extreme events, and optimize designs more robustly.
Types of Skewness
Skewness typically falls into three categories:
-
Positive Skewness (Right-Skewed)
A positively skewed distribution has a long tail extending to the right. This means the majority of the data points are concentrated on the left side of the graph, and there are a few larger values that pull the mean upwards. For such distributions, the mean is typically greater than the median.
- Engineering Context: Often seen in failure times (e.g., component lasts a long time, but a few fail very early), stress concentration factors (most areas are fine, but a few hotspots exist), or cost distributions (most projects are on budget, but a few overrun significantly).
-
Negative Skewness (Left-Skewed)
Conversely, a negatively skewed distribution has a long tail extending to the left. Here, most data points are concentrated on the right side, and there are a few smaller values pulling the mean downwards. For negatively skewed data, the mean is typically less than the median.
- Engineering Context: Can appear in performance metrics where higher values are desired, but a few instances perform poorly (e.g., high-quality manufacturing process with a few defective parts, yield strength of a material where most values are high, but a few tests show lower values).
-
Zero Skewness (Symmetrical)
A distribution with zero skewness is perfectly symmetrical. The most common example is the normal distribution (bell curve). In a symmetrical distribution, the mean, median, and mode are all approximately equal.
- Engineering Context: Idealized material properties, measurement errors that are equally likely to be positive or negative, or well-controlled process variations. Real-world data rarely achieves perfect symmetry, but often approximates it.
Skewness at a Glance: Mean vs. Median Relationship
A quick indicator of skewness often comes from comparing the mean and the median:
- Mean > Median: Positive (right) skew. The mean is pulled towards the higher values.
- Mean < Median: Negative (left) skew. The mean is pulled towards the lower values.
- Mean ≈ Median: Approximately symmetrical.
Why Does Skewness Matter in Engineering?
Understanding skewness is not just a statistical exercise; it has profound practical implications across various engineering disciplines:
Structural Engineering & Integrity (FFS Level 3)
-
Material Properties:
The yield strength or ultimate tensile strength of a material might be negatively skewed if a manufacturer produces consistently high-strength batches but occasionally has a batch with slightly lower properties. Designing with just the mean strength could be unsafe if the lower tail represents a significant risk.
-
Load Distributions:
Environmental loads (wind, earthquake, wave heights) are often positively skewed, meaning extreme, high-magnitude events are rare but crucial for design. Designing for the average load would be catastrophic.
-
Corrosion Rates (Oil & Gas):
Corrosion data for pipelines or pressure vessels can be positively skewed, indicating that while most areas corrode slowly, certain hotspots or conditions lead to rapid, dangerous material loss. FFS (Fitness for Service) Level 3 assessments rely heavily on understanding these distributions to predict remaining life accurately.
FEA / CFD / CAD-CAE Workflows
-
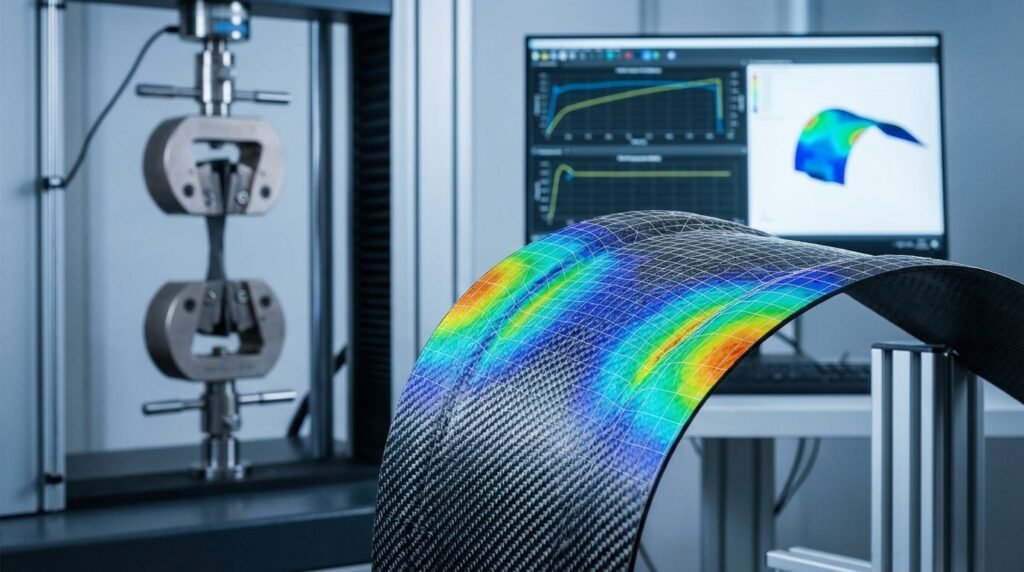
Stress Distributions in FEA:
Post-processing FEA results for stress or strain often reveals positively skewed distributions. Most of a component might experience low stress, but there will be specific, localized regions (e.g., fillets, holes, sharp corners) with significantly higher stress concentrations. Identifying and characterizing this skew is vital for fatigue analysis, failure prediction, and optimization.
-
Velocity Profiles in CFD:
In fluid dynamics, velocity distributions in boundary layers or near obstacles can exhibit skewness. For instance, flow in a pipe might be relatively uniform in the core but show steep gradients and potentially skewed velocity profiles near the walls. This impacts drag, heat transfer, and mixing efficiency.
-
Manufacturing Tolerances:
Dimensions of manufactured parts might be skewed if a machine tends to drift in one direction or if tooling wear introduces a bias, impacting assembly fit and performance. CAE analysts use this understanding to perform robust design and tolerance stack-up analysis.
Aerospace & Biomechanics
-
Fatigue Life Data:
Fatigue test data for aerospace components is typically negatively skewed. Most samples will exhibit a long fatigue life, but a few will fail prematurely due to micro-defects or material inconsistencies. Engineers must design for the lower tail of this distribution to ensure safety.
-
Biomechanical Response:
Data from biomechanical simulations (e.g., stress on an implant, force distribution in joints) can be skewed, reflecting the unique physiological variations and loading conditions. Understanding this helps in designing safer and more effective medical devices.
Here’s a summary of skewness types and their common engineering implications:
| Skewness Type | Mean vs. Median | Typical Data Distribution | Engineering Implication Examples |
|---|---|---|---|
| Positive (Right-Skewed) | Mean > Median | Tail extends to the right; few high values | Stress concentrations in FEA, failure times, component costs, environmental loads |
| Negative (Left-Skewed) | Mean < Median | Tail extends to the left; few low values | Material yield strength, fatigue life, product reliability scores |
| Zero (Symmetrical) | Mean ≈ Median | Balanced, bell-shaped distribution | Idealized measurement errors, perfectly controlled process variations |
Calculating Skewness
While the visual inspection of a histogram provides a good qualitative understanding, a quantitative measure of skewness is essential. The most common method is the moment coefficient of skewness (also known as Fisher’s skewness coefficient).
Most statistical software and programming libraries can calculate this for you:
- Python: Libraries like
SciPy.stats(scipy.stats.skew) orPandas(DataFrame.skew()) provide straightforward functions.import pandas as pd data = pd.Series([10, 12, 11, 15, 20, 100]) print(data.skew()) # Output will be a positive value, indicating right skew - MATLAB: The built-in
skewness()function works directly on arrays.data = [10 12 11 15 20 100]; sk = skewness(data); % sk will be a positive value - Excel: Use the
SKEWfunction:=SKEW(range). - FEA/CFD Post-processors: While not always directly displaying skewness, these tools allow data export (e.g., nodal stresses, element velocities) to CSV or text files, which can then be analyzed using Python, MATLAB, or Excel.
The calculated value helps you quantify the degree and direction of asymmetry:
- Positive value: Right (positive) skew.
- Negative value: Left (negative) skew.
- Zero or near-zero value: Symmetrical distribution.
Rules of thumb for interpreting the magnitude:
- Skewness between -0.5 and 0.5: Fairly symmetrical.
- Skewness between -1 and -0.5 or 0.5 and 1: Moderately skewed.
- Skewness < -1 or > 1: Highly skewed.
These are general guidelines; the acceptable level of skewness often depends on the specific engineering application and its associated risks.
Interpreting Skewness: What Does it Tell You?
Beyond the number, the true value of skewness lies in its practical interpretation:
- Risk Assessment: For positively skewed data like stress concentrations, a high skewness means there are potentially dangerous hotspots you must address, even if the average stress is acceptable. For negatively skewed data like material strength, a significant left tail indicates a risk of components failing at lower-than-average loads.
- Central Tendency Choice: If your data is highly skewed, the mean can be a misleading representation of the “typical” value because it’s pulled by the extreme tail. In such cases, the median often provides a more robust and representative measure of the central tendency. For example, the median lifespan of a component might be more practical than the mean if early failures skew the mean downwards.
- Process Control: In manufacturing, if process parameters (e.g., temperature, pressure) exhibit skewness, it could indicate a process drift or an underlying issue that needs investigation to ensure consistent product quality.
- Distribution Assumptions: Many statistical tests and engineering models assume normally distributed (symmetrical) data. If your data is significantly skewed, these assumptions are violated, and the results of your analysis might be invalid. You may need to use non-parametric methods or transform your data.
Practical Workflow: Integrating Skewness in Engineering Analysis
Incorporating skewness analysis into your engineering workflow can significantly improve data-driven decision-making:
1. Data Collection & Preparation
- Source Data: Gather relevant data from simulations (e.g., Abaqus ODB exports, ANSYS RST files, Fluent/CFX results processed in Paraview), experimental tests, sensor networks, or historical records.
- Clean & Filter: Handle outliers, missing values, and irrelevant data points. Outliers can heavily influence skewness calculations and distort the true underlying distribution.
- Identify Variables: Clearly define the variables you are analyzing (e.g., von Mises stress, displacement, fluid velocity, material yield strength, temperature).
2. Calculation & Visualization
- Generate Histograms: Always start with a visual. Plot histograms of your data. This immediately shows you the shape of the distribution and hints at any skewness. Adjust bin sizes to reveal patterns.
- Calculate Skewness Coefficient: Use Python, MATLAB, Excel, or dedicated statistical software to quantify the skewness. This provides an objective measure to supplement your visual inspection.
- Compare Mean & Median: As a quick check, compare these two measures. If they diverge significantly, it’s a strong indicator of skewness.
- Consider Q-Q Plots: For assessing normality alongside skewness, a Quantile-Quantile (Q-Q) plot can be very informative. Deviations from the straight line indicate non-normality, including skewness.
3. Interpretation & Action
- Contextualize: Relate the calculated skewness back to the physical engineering problem. What does a positive skew in stress data mean for fatigue life? What does a negative skew in material strength imply for safety factors?
- Re-evaluate Assumptions: If significant skewness is detected, reconsider any assumptions of normality in your downstream analyses (e.g., p-values in hypothesis testing, confidence intervals).
- Consider Transformations: If necessary, apply data transformations (e.g., logarithmic, square root) to reduce skewness and bring the distribution closer to normal, making it suitable for parametric statistical methods.
- Adjust Design/Process: Based on the implications, you might need to:
- Modify a structural design to mitigate stress concentrations (positive skew).
- Refine a manufacturing process to reduce early failures (negative skew).
- Update safety factors or design margins.
If you’re grappling with large datasets or complex simulations, remember that platforms like EngineeringDownloads offer affordable HPC rental to run models efficiently, alongside expert project consultancy to help interpret challenging results.
Verification & Sanity Checks
Before drawing firm conclusions from your skewness analysis, always perform robust verification and sanity checks:
- Data Source Integrity: Ensure the data you are analyzing is reliable and correctly collected. Was there a sensor malfunction? Was the simulation converged and stable?
- Outlier Impact: Rerun your skewness calculations with and without extreme outliers to understand their influence. Sometimes a few data points can disproportionately skew the distribution.
- Sample Size: Be mindful of small sample sizes. Skewness estimates from small samples can be highly variable and unreliable. As a rule of thumb, larger samples provide more stable estimates.
- Mesh Sensitivity (FEA/CFD): For simulation results, confirm that the mesh resolution is adequate, especially in regions of high gradients or where stress concentrations occur. A coarse mesh might smooth out important local variations, potentially masking true skewness.
- Boundary Condition & Load Checks: Verify that boundary conditions and applied loads were realistic and accurately represent the physical scenario. Incorrect inputs can lead to artifactual skewness in the results.
- Convergence Criteria: For iterative solutions like in CFD or non-linear FEA, ensure that your simulation has fully converged to a stable solution. Non-converged results can exhibit misleading distributions.
- Physical Plausibility: Does the observed skewness make physical sense? For instance, it’s physically plausible for stress to be positively skewed in a component with sharp corners, but highly negatively skewed stress might warrant further investigation of your model or analysis.
Common Mistakes and Pitfalls
Avoid these common errors when dealing with skewness in engineering data:
- Assuming Normality: Blindly applying statistical methods that assume normally distributed data (e.g., t-tests, ANOVA) when the data is significantly skewed can lead to incorrect p-values and faulty conclusions.
- Ignoring the “Tail”: Focusing solely on the mean and standard deviation without considering the direction and length of the tail can lead to underestimating risks or missing critical design flaws. The tail often holds the most crucial information for reliability and failure analysis.
- Misinterpreting the Sign: Confusing positive and negative skewness, leading to incorrect inferences about the data’s concentration.
- Over-reliance on a Single Metric: Don’t just look at the skewness coefficient. Always pair it with a visual inspection (histogram) and comparison of mean/median/mode to get a complete picture.
- Small Sample Bias: Calculating skewness on very small datasets can produce unreliable and highly variable estimates. Be cautious with interpretation when N is small.
Troubleshooting Skewed Data
When you encounter significantly skewed data, here’s how you can approach it:
- Understand the Cause: First, try to understand why the data is skewed. Is it inherent to the physical phenomenon (e.g., fatigue life), a result of measurement limitations, or an artifact of your simulation setup? Knowing the cause can inform the best corrective action.
- Data Transformation: For positively skewed data, common transformations include the square root (
sqrt(x)) or logarithmic (log(x)) transformation. For negatively skewed data, reflecting the data (max(x) - x) and then applying a log or square root transformation can help. Be aware that transformations can make interpretation of results less intuitive. - Non-Parametric Methods: If transforming the data is not feasible or desirable, consider using non-parametric statistical methods that do not assume a specific distribution shape. Examples include the Wilcoxon signed-rank test or Kruskal-Wallis test instead of t-tests or ANOVA, respectively.
- Robust Statistics: Use robust measures of central tendency (median) and spread (Interquartile Range – IQR) that are less sensitive to extreme values or skewness than the mean and standard deviation.
- Binning for Visualization: When visualizing highly skewed data, experiment with different binning strategies for histograms or use density plots to better reveal the underlying shape without being dominated by the long tail.
Tools for Analyzing Skewness
Modern engineering workflows leverage a variety of tools for data analysis, including skewness:
- Python with Libraries:
Pandas: Excellent for data manipulation and includes.skew()method for Series/DataFrames.SciPy.stats: Providesscipy.stats.skew()for direct skewness calculation and other statistical functions.Matplotlib/Seaborn: Powerful for creating insightful histograms, density plots, and Q-Q plots to visualize skewness.
- MATLAB:
skewness(): A built-in function for calculating skewness.histogram(): For visualizing data distributions.fitdist()/probplot(): For fitting distributions and creating probability plots to assess normality and skew.
- Spreadsheet Software (e.g., Excel, Google Sheets):
SKEW()function: Simple for quick calculations on smaller datasets.- Data Analysis ToolPak: Offers histograms and descriptive statistics.
- Dedicated Statistical Software: Tools like Minitab, R (with various packages), or JMP provide advanced features for distribution analysis, including skewness, and often specialized charts.
- CAE Post-Processors (Indirectly): While Abaqus/CAE, ANSYS Mechanical, HyperView, or OpenFOAM’s Paraview don’t typically calculate skewness directly, they are crucial for exporting raw simulation data (e.g., stress, strain, velocity fields) which can then be fed into the tools listed above for detailed statistical analysis.
Conclusion
Skewness is a fundamental characteristic of data distributions that engineers simply cannot afford to ignore. It provides critical insights into the asymmetry of your data, helping you understand where values are concentrated, the likelihood of extreme events, and the true “typical” value of a parameter. By integrating skewness analysis into your engineering toolkit – whether through visual inspection, numerical calculation, or advanced statistical methods – you can make more robust designs, perform more accurate risk assessments, and ultimately, build more reliable systems.
Embrace skewness, and you’ll unlock a deeper understanding of the variations and uncertainties inherent in all engineering endeavors.
Frequently Asked Questions (FAQ)
Here are some common questions about skewness in an engineering context:
Q1: What’s the main difference between skewness and kurtosis?
A1: Skewness measures the asymmetry of a distribution, indicating if one tail is longer or fatter than the other. Kurtosis, on the other hand, measures the “tailedness” or “peakedness” of a distribution, telling you how many outliers exist and how concentrated the data is around the mean compared to a normal distribution. Both are moments of a distribution but describe different characteristics.
Q2: When is a positively skewed distribution problematic in engineering?
A2: A positively skewed distribution is problematic when the long right tail represents undesirable or dangerous high values. For example, high positive skewness in stress concentrations could indicate critical hotspots leading to fatigue failure. In cost estimation, a positive skew means a higher chance of projects significantly exceeding budget.
Q3: Can real-world engineering data ever be perfectly symmetrical (zero skewness)?
A3: While mathematically possible, perfect symmetry (zero skewness) is extremely rare in real-world engineering data due to inherent variability, measurement errors, and underlying physical processes. Data can often be approximated as symmetrical if the skewness coefficient is very close to zero (e.g., between -0.5 and 0.5), allowing for the use of parametric statistical methods.
Q4: How does sample size affect the calculation and interpretation of skewness?
A4: For small sample sizes, the calculated skewness can be highly variable and may not accurately represent the true population skewness. As the sample size increases, the estimate of skewness becomes more stable and reliable. Always be cautious when interpreting skewness from limited data sets.
Q5: Is data transformation always the best solution for skewed data?
A5: Not always. While transformations (like log or square root) can reduce skewness and allow the use of parametric tests, they can also make the data harder to interpret in its original physical units. It’s crucial to understand the implications of transformation for your specific engineering problem. Sometimes, using non-parametric methods or robust statistics that don’t assume normality is a more appropriate approach.
Further Reading
For more technical details on calculating skewness in Python, refer to the SciPy documentation on scipy.stats.skew.