In the world of engineering simulation, generating results is only half the battle. The real power lies in effectively understanding, interpreting, and communicating those results. This crucial final step is known as post-processing. Whether you are running Finite Element Analysis (FEA) for structural integrity, Computational Fluid Dynamics (CFD) for aerospace applications, or multi-body dynamics for biomechanics, extracting meaningful insights from gigabytes of raw data is paramount for informed decision-making.

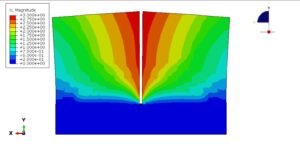
Image courtesy of Kitware, Inc. via Wikimedia Commons, showing a CFD post-processing visualization.
What is Post-Processing in Engineering Simulation?
Post-processing is the process of converting raw, numerical output data from a simulation (like nodal displacements, element stresses, velocity fields, temperature distributions, or pressure contours) into a format that is easily understandable, interpretable, and actionable. It involves various techniques, from graphical visualizations to quantitative data extraction and analysis, enabling engineers to validate designs, troubleshoot issues, and predict performance.
Why is Effective Post-Processing Critical?
- Informed Decision-Making: Transforms complex data into clear insights, guiding design improvements and validation.
- Identification of Critical Areas: Pinpoints high-stress zones, regions of potential failure, or areas of turbulent flow.
- Performance Prediction: Helps in predicting how a component or system will behave under various operating conditions.
- Troubleshooting & Optimization: Essential for diagnosing unexpected simulation behavior and iterating on designs for better performance.
- Communication: Visualizations and clear reports are vital for effectively communicating findings to stakeholders, clients, and team members.
- Compliance & Certification: Provides the necessary evidence for design validation against industry standards (e.g., FFS Level 3 for Oil & Gas).
Key Stages of Post-Processing
Post-processing typically involves a series of steps that take you from raw numbers to actionable conclusions.
Data Extraction & Filtering
Before any visualization or advanced analysis, you need to extract the relevant data. This often involves:
- Selecting Result Fields: Choosing specific output variables (e.g., Von Mises stress, total displacement, fluid velocity, temperature).
- Identifying Critical Time Steps: For transient analyses, isolating moments of peak load, maximum deformation, or steady-state conditions.
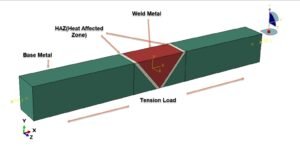
- Filtering by Region: Focusing on specific parts of the model (e.g., a weld seam, an inlet pipe, a critical bearing location) to reduce data volume and enhance focus.
Visualization Techniques
Visualizing data is crucial for quickly grasping complex patterns and identifying trends. Most modern CAE software (Abaqus, ANSYS Mechanical, Fluent, OpenFOAM via ParaView, MSC Patran/Nastran) offer robust visualization tools.
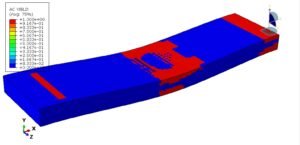
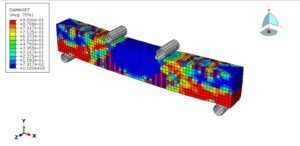
Contour Plots
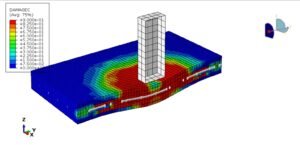
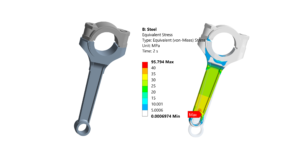
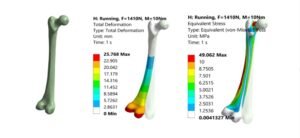
These are perhaps the most common visualization tool, showing the distribution of a scalar quantity (like stress, temperature, or pressure) over a surface or volume using color gradients. They immediately highlight areas of high or low values.
Vector Plots
Used primarily in CFD, vector plots display directional quantities such as fluid velocity or heat flux. Arrows indicate both the magnitude and direction of the vector field, revealing flow patterns and recirculation zones.
Animations
For transient simulations (e.g., impact analysis, fluid flow evolution, modal analysis), animations are invaluable. They show the progression of results over time, helping to understand dynamic behavior and identify critical events that might be missed in static plots.
XY Plots & Probes
These plots represent a scalar quantity along a path, over time, or at specific points (probes). Examples include stress vs. time, pressure drop along a pipeline, or displacement at a specific node. They are essential for quantitative comparisons and trend analysis.
Quantitative Analysis
While visualizations provide qualitative insights, quantitative analysis provides the hard numbers needed for design validation and compliance.
- Maximum/Minimum Values: Identifying peak stresses, maximum deflections, or extreme temperatures.
- Averages & Integrals: Calculating average pressures on a surface, total reaction forces, or mass flow rates.
- Safety Factors: Comparing calculated stresses with material yield strengths or design limits.
- Comparison with Criteria: Checking if results meet specific design codes or performance metrics.
Reporting & Documentation
The final stage is compiling all findings into a clear, concise report. This includes high-quality images, plots, tables of critical values, and a summary of conclusions and recommendations. A well-structured report ensures that the insights from the simulation are preserved and effectively communicated.
Practical Workflow: Post-Processing Your FEA/CFD Results
Follow these steps for an efficient and robust post-processing workflow:
Step 1: Understand Your Objectives
Before diving into the data, revisit your simulation goals. What questions were you trying to answer? What critical values or behaviors do you need to extract? This focus will guide your entire post-processing effort.
Step 2: Load and Inspect Raw Data
Open your results file (e.g., .odb for Abaqus, .rst for ANSYS, .cas/.dat for Fluent). Start with a quick overview: visualize displacements/velocities to get a general sense of the deformation or flow patterns. Look for any obviously anomalous behavior.
Step 3: Choose Appropriate Visualizations
Based on your objectives, select the most suitable visualization:
- For structural integrity: Contour plots of Von Mises stress, principal stresses, and displacement.
- For fluid dynamics: Contour plots of pressure, temperature; vector plots of velocity; streamlines; animations of transient flow.
- For fatigue analysis: Critical stress locations, stress intensity factors.
Step 4: Extract Key Quantitative Data
Use probing tools to get exact values at critical points, generate XY plots for trends, and run reports for max/min values. For example, calculate reaction forces, total heat transfer, or pressure drops across components. Python scripts with libraries like NumPy and SciPy are excellent for automating complex data extraction from large datasets.
Step 5: Document and Report
Capture screenshots, export data to spreadsheets, and write a detailed report. Explain your findings, compare them against design criteria, and provide clear conclusions and recommendations. Ensure units are clearly stated.
Verification & Sanity Checks in Post-Processing
Never take simulation results at face value. A rigorous verification process during post-processing is crucial for confidence.
Checking for Expected Trends
Does the deformation pattern look logical for the applied loads? Does fluid flow follow expected paths? High stresses/velocities should generally occur in expected regions (e.g., sharp corners, narrow passages). If a beam bends upwards under gravity, something is wrong!
Energy Balance
For many simulations (especially transient or coupled physics), checking energy balance can be a powerful verification. Does the work done by external forces equal the internal strain energy plus kinetic energy (and any damping/dissipation)? Software like Abaqus and ANSYS often provide this as an output.
Boundary Condition Influence
Carefully examine the results near boundary conditions. Are the stresses/deformations localized as expected, or are they propagating too far into the model, potentially indicating a rigid body motion or over-constrained region? For CFD, check velocity profiles at inlets/outlets.
Mesh Sensitivity
Ensure your results are independent of the mesh density. If refining the mesh in a critical region significantly changes the peak stress or flow parameter, your current results might not be converged. This check should ideally be done before final post-processing, but confirming stability during results interpretation is also vital.
Comparison with Analytical/Experimental Data
Where possible, compare key results (e.g., maximum deflection, natural frequency, pressure drop) with hand calculations, simplified analytical solutions, or experimental data. This is the ultimate validation step.
Common Post-Processing Tools
A wide array of software is available, ranging from integrated modules within CAE suites to standalone, versatile platforms.
Commercial Software
- Abaqus/Viewer: Integrated post-processor for Abaqus FEA, renowned for its powerful scripting capabilities with Python.
- ANSYS Mechanical/CFD-Post: Comprehensive visualization and data extraction tools for both structural and fluid simulations within the ANSYS ecosystem (Fluent, CFX).
- MSC Patran/Nastran: Patran serves as a pre- and post-processor, offering extensive visualization and analysis features for Nastran results.
- Siemens Simcenter (e.g., STAR-CCM+, FEMAP): Provides integrated post-processing environments tailored to their respective solvers.
- HyperView (Altair): A high-performance 3D post-processor for various solver results, excellent for large models and animations.
Open-Source & Scripting
- ParaView: An open-source, multi-platform data analysis and visualization application, widely used for CFD (especially with OpenFOAM) and large datasets. Supports powerful Python scripting.
- Python: With libraries like Matplotlib, NumPy, SciPy, and specialized modules for CAE data (e.g.,
abaqus caefor Abaqus,pyvista), Python is an invaluable tool for automating data extraction, custom plotting, and report generation. - MATLAB: Another powerful environment for numerical computation and visualization, often used for scripting custom post-processing routines, especially when integrating with experimental data or developing custom analysis algorithms.
Common Plots and Their Engineering Applications
| Plot Type | Typical Application (FEA/CFD) | Engineering Insight |
|---|---|---|
| Contour Plot (Stress) | FEA: Structural components, pressure vessels | Identify high-stress concentrations, potential failure points, material yield |
| Contour Plot (Displacement) | FEA: Deflection of beams, plates, full assemblies | Measure maximum deformation, check against allowable deflections |
| Contour Plot (Pressure/Temperature) | CFD: Aerodynamics, heat exchangers; FEA: Thermal analysis | Visualize pressure drops, hot spots, thermal gradients |
| Vector Plot (Velocity) | CFD: Flow around airfoils, through pipes | Show fluid flow direction and magnitude, identify recirculation zones |
| XY Plot (Time History) | FEA/CFD: Transient analysis, dynamic response | Track variable changes over time (e.g., force vs. time, pressure at probe) |
| Streamlines | CFD: Complex flow paths, mixing efficiency | Visualize fluid pathlines, understand flow topology |
Best Practices & Troubleshooting
Tips for Efficient Post-Processing
- Plan Ahead: Know what data you need before you start.
- Automate Repetitive Tasks: Use scripting (Python/MATLAB) for common plots or data extractions, especially for design parameter studies.
- Use Templates: Create report templates or script templates for consistent analysis and reporting.
- Organize Results: Name plots logically, save critical views, and structure your output files.
Common Mistakes to Avoid
- Misinterpreting Color Legends: Always pay attention to the scale and units. A ‘red’ area might not be critical if the scale is misleading.
- Ignoring Units: Inconsistent or overlooked units can lead to catastrophic misinterpretations.
- Over-Reliance on Default Views: Always customize views, cut planes, and isosurfaces to reveal the most relevant information.
- Neglecting Convergence: Post-processing unconverged results will yield meaningless data.
- Zooming In Too Much: While detail is good, always maintain context. A high stress value on a single element might be a singularity, not a real problem.
Troubleshooting Display Issues
- Graphics Card Drivers: Ensure your drivers are up-to-date for optimal rendering performance.
- Model Complexity: Large models can strain system resources. Consider using cut planes or sub-modeling techniques.
- Output Database Size: Extremely large results files can slow down loading and rendering. Only request relevant output variables and save intervals.
Feeling overwhelmed by complex post-processing tasks or need custom scripts for your specific engineering challenges? EngineeringDownloads.com offers a wealth of downloadable Python and MATLAB scripts to streamline your workflow and accelerate your analysis. We also provide online consultancy for advanced CAE post-processing challenges.
Conclusion
Post-processing is more than just pretty pictures; it’s the bridge between raw simulation data and actionable engineering insights. By mastering the techniques, leveraging powerful tools, and rigorously verifying your results, you can confidently transform complex numerical outputs into robust design decisions. This skill is indispensable for any engineer utilizing FEA, CFD, or other CAE methods to drive innovation and ensure structural integrity and performance across industries like Oil & Gas, Aerospace, and Biomechanics.
Further reading: ANSYS Blog: Best Practices for CFD Post-Processing