Understanding and predicting fatigue life is a cornerstone of reliable structural engineering. From aerospace components to oil and gas infrastructure, preventing unexpected failures due to cyclic loading is paramount. This guide cuts through the academic jargon to provide a clear, practical roadmap for engineers tackling fatigue challenges.

Image Credit: Material fatigue surface showing crack propagation. Source: Wikimedia Commons.
What is Fatigue and Why Does it Matter?
Fatigue isn’t a sudden event; it’s a progressive, localized, and permanent structural damage process that occurs when a material is subjected to cyclic or fluctuating stresses and strains. Even if these stresses are far below the material’s yield strength, over time, microscopic cracks can initiate and propagate, leading to catastrophic failure.
The Basics of Fatigue
- Crack Initiation: Typically occurs at stress concentrations (e.g., notches, holes, surface imperfections) or material defects.
- Crack Propagation: The initiated crack grows with each loading cycle. This stage often leaves characteristic ‘beach marks’ on the fracture surface.
- Final Fracture: When the remaining cross-section can no longer sustain the applied load, rapid brittle fracture occurs.
Why Engineers Care: Consequences of Fatigue Failure
Ignoring fatigue can have severe consequences, including:
- Catastrophic Failures: Sudden, often unpredicted structural collapse, leading to loss of life and property.
- High Repair Costs: Replacing failed components or entire structures is expensive and time-consuming.
- Reputational Damage: Fatigue failures can severely impact a company’s standing and public trust.
- Regulatory Compliance: Many industries, especially aerospace and oil & gas, have strict regulations requiring robust fatigue analysis.
Key Factors Influencing Fatigue Life
Predicting fatigue life isn’t a simple equation. It’s a complex interplay of several critical factors. Understanding these helps in designing more resilient structures.
Material Properties
- Ultimate Tensile Strength (UTS) and Yield Strength (YS): Generally, higher strength materials tend to have better fatigue resistance, but this isn’t always linear.
- Ductility: More ductile materials can often redistribute stresses better, potentially delaying crack initiation, especially under high-strain conditions.
- Hardness: Surface hardness can improve fatigue resistance by hindering crack initiation.
- Microstructure: Grain size, inclusions, and heat treatment all play a significant role.
Loading Conditions
- Stress Amplitude: The range of stress experienced during a cycle is the most critical factor. Higher amplitude means shorter life.
- Mean Stress: A tensile mean stress generally reduces fatigue life, while a compressive mean stress can increase it.
- Load Ratio (R-ratio): Defines the ratio of minimum to maximum stress (σ_min / σ_max) and significantly impacts fatigue life.
- Frequency: While less critical for metals at ambient temperatures, high frequencies can induce heat, affecting properties.
- Random vs. Constant Amplitude: Real-world loads are often random, requiring sophisticated cycle counting methods like Rainflow counting.
Geometry and Stress Concentrations
Any abrupt change in geometry (holes, fillets, sharp corners) acts as a stress concentrator. These areas are prime locations for fatigue crack initiation.
- Stress Concentration Factor (K_t): A theoretical factor quantifying stress amplification.
- Fatigue Notch Factor (K_f): An experimental factor accounting for the material’s sensitivity to notches.
- Design Optimization: Proper fillet radii, smooth transitions, and avoiding sharp corners are fundamental.
Surface Finish and Residual Stresses
- Surface Finish: Rough surfaces provide more sites for crack initiation. Polishing, shot peening, or surface coatings can significantly enhance fatigue life.
- Residual Stresses: Compressive residual stresses on the surface (e.g., from shot peening, induction hardening) can delay crack initiation by offsetting applied tensile stresses. Tensile residual stresses are detrimental.
Common Methodologies for Fatigue Life Prediction
Engineers employ several approaches to predict fatigue life, each with its strengths and suitable applications.
Stress-Life (S-N) Approach
The S-N curve approach (also known as the Wohler curve) relates the stress amplitude (S) to the number of cycles to failure (N) for a given material. It’s primarily used for high-cycle fatigue (HCF) where stresses are elastic.
Practical Steps for S-N Analysis
- Determine Applied Stresses: Use analytical methods or FEA to find stress amplitudes and mean stresses.
- Obtain S-N Data: Gather experimental S-N curves for the specific material and loading conditions. These are often corrected for mean stress effects using theories like Goodman, Gerber, or Soderberg.
- Apply Damage Rule: For variable amplitude loading, use a cumulative damage rule like Miner’s Rule: Σ(n_i / N_i) = 1 (where n_i is the number of cycles at stress level i, and N_i is the fatigue life at that stress level).
- Calculate Fatigue Life: Estimate the total number of cycles to failure.
Limitations of S-N Approach
- Doesn’t explicitly account for local plastic deformation.
- Less accurate for low-cycle fatigue (LCF) where plastic strains are significant.
- Sensitive to surface finish and stress concentrations.
Strain-Life (ε-N) Approach
The strain-life approach focuses on local strains rather than stresses, making it more suitable for low-cycle fatigue (LCF) where plastic deformation occurs. It characterizes the total strain amplitude (elastic + plastic) against the number of reversals to failure.
When to Use the ε-N Approach
- Components experiencing significant plastic deformation.
- Applications with high stress concentrations.
- Predicting crack initiation life more accurately.
Fracture Mechanics Approach
Unlike S-N and ε-N, which primarily predict crack initiation life, fracture mechanics focuses on predicting the propagation life of an existing crack. This is critical for damage-tolerant design, especially in industries like aerospace and FFS Level 3 assessments in oil & gas.
Crack Growth Prediction
The Paris-Erdogan law is a widely used model for stable crack growth:
da/dN = C (ΔK)^m
da/dN: Crack growth rate per cycle.C, m: Material constants determined experimentally.ΔK: Stress intensity factor range.
Integration of this law, considering initial crack size and critical crack size, yields the number of cycles for crack propagation.
Practical Workflow with FEA for Fatigue Analysis
Finite Element Analysis (FEA) is indispensable for accurate fatigue life prediction, especially for complex geometries and loading conditions. Tools like Abaqus and ANSYS Mechanical are widely used.
FEA Software for Fatigue Analysis
- ANSYS Mechanical: Offers comprehensive fatigue tools, including stress-life, strain-life, and advanced solvers for crack propagation.
- Abaqus: Powerful for non-linear analysis, often coupled with scripting (Python) for complex fatigue damage models or fracture mechanics (XFEM, VCCT).
- MSC Patran/Nastran: Traditional tools for linear and non-linear analysis, with dedicated modules for fatigue.
Step-by-Step FEA Simulation for Fatigue
1. Geometry and Meshing
- CAD Import/Creation: Start with a clean CAD model. Simplify features that don’t significantly affect stress distribution.
- Mesh Generation: Use a finer mesh in areas of expected high stress concentration (e.g., fillets, holes, weld toes). Quadratic elements (e.g., 8-node bricks, 6-node wedges) are generally preferred for stress accuracy.
- Mesh Quality: Ensure good element aspect ratio, skewness, and Jacobian. Poor mesh quality can lead to inaccurate stress results, which directly impact fatigue predictions.
2. Material Definition
- Elastic Properties: Young’s Modulus, Poisson’s Ratio.
- Plastic Properties: Stress-strain curves (if using strain-life or non-linear analysis).
- Fatigue Properties: S-N curves, ε-N curves, Paris law constants. These are critical and must be experimentally derived for your specific material, environment, and surface condition.
3. Loading and Boundary Conditions
- Apply Loads: Define cyclic loads (e.g., pressure cycles, force variations) accurately. Consider load history and spectrum.
- Boundary Conditions: Correctly constrain the model to represent real-world support conditions. Be mindful of introducing artificial stress concentrations.
- Mean Stress Correction: If using S-N curves, ensure your FEA results (stress amplitudes and mean stresses) are correctly fed into the chosen mean stress correction model.
4. Analysis and Post-processing
- Static/Transient Analysis: Perform a static or quasi-static stress analysis to determine the stress state. For dynamic loads, transient analysis might be required.
- Fatigue Tool Integration: Most FEA software has integrated fatigue modules that take the stress/strain results and material fatigue data to calculate life, damage, or safety factors.
Post-Processing and Results Interpretation
Once the analysis is complete, don’t just look at the lowest life prediction. Dig deeper:
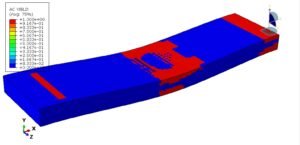
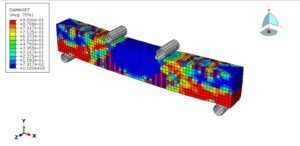
- Contour Plots: Visualize fatigue life and damage contours to identify critical regions.
- Stress Gradients: Understand how stresses vary, especially near potential crack initiation sites.
- Sensitivity to Parameters: How sensitive is the predicted life to variations in material properties, load amplitudes, or mean stress?
Verification & Sanity Checks in Fatigue Analysis
FEA is powerful, but garbage in, garbage out. Rigorous verification is crucial.
Mesh Sensitivity
Perform a mesh convergence study. Refine the mesh in critical areas until the stress results (especially peak stresses) stabilize. For fatigue, ensure you’re capturing stress gradients accurately.
Boundary Condition Impact
Test the sensitivity of your results to slight variations in boundary conditions. Are your constraints realistic? Could local flexibility alter the stress distribution?
Convergence Criteria
For non-linear and transient analyses, ensure the solution has converged adequately. Check energy norms and force imbalances.
Validation with Experimental Data
Whenever possible, validate your FEA model against experimental test data for similar components or standardized fatigue tests. This is the ultimate check of your model’s fidelity.
Sensitivity Analysis
Vary key input parameters (e.g., material fatigue strength, load magnitude, R-ratio) within their expected ranges. Understand how robust your design is to these uncertainties. Python scripts or MATLAB can be invaluable here for automating parameter sweeps.
Common Mistakes to Avoid in Fatigue Analysis
- Using Generic Material Data: Always strive for specific S-N/ε-N curves for your material, heat treatment, surface finish, and environment.
- Ignoring Mean Stress Effects: Failure to account for tensile mean stresses will lead to over-optimistic life predictions.
- Inadequate Meshing: Coarse meshes at stress concentration points are a recipe for inaccurate stress predictions and, consequently, wrong fatigue life.
- Overlooking Surface Conditions: Surface roughness, residual stresses, and coatings have a profound impact on fatigue initiation.
- Misinterpreting FEA Stresses: Peak stresses at singular points (e.g., sharp corners in ideal models) are theoretical and need careful interpretation, often requiring fatigue notch factors or structural stress approaches.
- Assuming Infinite Life: Most materials do not have a true fatigue limit in all environments. Always design for a finite life or a very high number of cycles.
Leveraging Python & MATLAB for Fatigue Analysis
For advanced or repetitive fatigue analysis, scripting with Python or MATLAB can dramatically improve efficiency and accuracy:
- Data Processing: Automate the extraction of stress/strain results from FEA output files.
- Fatigue Life Calculation: Implement custom fatigue damage accumulation rules (e.g., sophisticated Miner’s variations, non-linear damage models).
- Parametric Studies: Easily run multiple simulations with varying material properties, load conditions, or geometric parameters to perform sensitivity analyses.
- Post-processing & Visualization: Generate custom plots, reports, and statistical analyses of fatigue life predictions.
- Load Spectrum Generation: Process raw sensor data into fatigue load spectra (e.g., using Rainflow counting algorithms).
Considering the depth of these topics, EngineeringDownloads.com offers specialized online consultancy and custom script development services. If you’re grappling with a particularly complex fatigue challenge or need help automating your workflow, our experts can provide tailored support.
Comparison of Fatigue Prediction Approaches
Choosing the right approach depends on the application, material behavior, and expected failure mode.
| Approach | Primary Application | Key Input | Pros | Cons |
|---|---|---|---|---|
| Stress-Life (S-N) | High-Cycle Fatigue (HCF), elastic regime | Stress Amplitude (S), Cycles (N) | Relatively simple, widely available data | Doesn’t account for local plasticity, less accurate for LCF |
| Strain-Life (ε-N) | Low-Cycle Fatigue (LCF), local plasticity | Strain Amplitude (ε), Reversals (2N) | Better for plastic deformation, crack initiation prediction | Requires local strain data, more complex material characterization |
| Fracture Mechanics | Crack Propagation, Damage Tolerance | Stress Intensity Factor (ΔK), Crack Size (a) | Predicts remaining life with existing crack, critical for FFS | Requires initial crack assumption, more complex calculations |
Further Reading
For more in-depth information on fatigue testing and standards, consult resources from authoritative bodies such as ASTM International: ASTM Fatigue & Fracture
Conclusion
Fatigue life prediction is a critical skill for any structural engineer. By carefully considering material properties, loading conditions, geometry, and employing robust methodologies like FEA combined with verification and validation, you can design structures that are safe, durable, and reliable. Remember to continuously refine your understanding and leverage modern tools like Python and MATLAB to stay ahead in this ever-evolving field.