Metal fatigue is one of the most common causes of failure in engineering structures, components, and machinery. Unlike sudden catastrophic overload, fatigue failures occur progressively over time due to repeated cyclic loading, often at stress levels well below a material’s ultimate tensile strength or even its yield strength. Understanding and accurately predicting fatigue life is paramount for ensuring the long-term reliability and safety of critical assets in industries ranging from aerospace and automotive to oil & gas and civil infrastructure.
This guide delves into the practical aspects of fatigue life prediction, providing engineers with a clear, actionable roadmap for incorporating fatigue considerations into their design and analysis workflows. We’ll cover fundamental concepts, common methodologies, and detailed steps for conducting fatigue analysis, particularly within a Finite Element Analysis (FEA) framework.

Image showing a typical S-N curve, used under Creative Commons Attribution-Share Alike 3.0 Unported license.
What is Metal Fatigue? A Brief Overview
Metal fatigue is a localized and progressive structural damage process that occurs when a material is subjected to repeated or fluctuating stresses. It’s not a material property itself but rather a response of a material to applied loading conditions. The process typically involves three stages:
- Crack Initiation: Microscopic cracks form at stress concentration points, such as surface defects, grain boundaries, or inclusions, due to plastic deformation at a microscopic level.
- Crack Propagation: These micro-cracks grow and link up under continued cyclic loading, eventually forming a macroscopic crack. This stage can be slow or rapid depending on the stress intensity and material properties.
- Final Fracture: The crack reaches a critical size, leading to a sudden, brittle-like fracture of the remaining cross-section when the remaining load-bearing area can no longer support the applied stress.
Why is Fatigue Life Prediction Critical for Engineers?
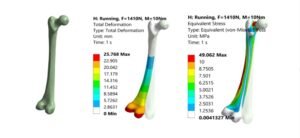
Ignoring fatigue can lead to catastrophic failures, significant financial losses, and, most importantly, loss of life. For engineers working on structures in sectors like Aerospace, Oil & Gas, or Biomechanics, fatigue prediction is non-negotiable. It informs design decisions, material selection, maintenance schedules, and overall structural integrity assessments, including Fitness-for-Service (FFS) Level 3 evaluations.
Key Concepts in Fatigue Analysis
Before diving into prediction methods, it’s essential to grasp these foundational concepts:
S-N Curves (Stress-Life)
Also known as Wöhler curves, S-N curves plot stress amplitude (S) against the number of cycles to failure (N) on a log-log scale. They are primarily used for High Cycle Fatigue (HCF) applications where stresses are predominantly elastic and lead to very long lives (typically > 10^4 cycles).
E-N Curves (Strain-Life)
E-N curves relate total strain amplitude to the number of cycles to failure. These are more suitable for Low Cycle Fatigue (LCF) applications where localized plastic deformation occurs, and life is shorter (typically < 10^4 cycles). The Coffin-Manson relationship is fundamental to this approach.
Endurance Limit / Fatigue Limit
For some materials (notably steels), there exists a stress amplitude below which fatigue failure will not occur, regardless of the number of load cycles. This is known as the endurance limit or fatigue limit. Aluminum alloys, however, typically do not exhibit a distinct endurance limit, meaning they will eventually fail given enough cycles, even at very low stress amplitudes.
Mean Stress Effects
The presence of a non-zero mean stress (the average stress in a cycle) can significantly affect fatigue life. Compressive mean stresses generally increase fatigue life, while tensile mean stresses decrease it. Common correction models include Goodman, Gerber, and Soderberg diagrams.
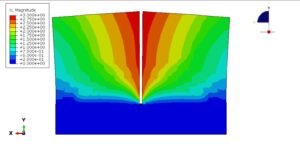
Stress Concentration
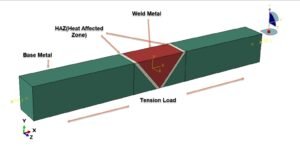
Geometric discontinuities (holes, fillets, notches, welds) cause localized stress amplification, known as stress concentration. These areas are preferential sites for fatigue crack initiation, making accurate stress concentration factor (Kt) assessment crucial.
Common Fatigue Prediction Methodologies
The choice of methodology depends on the material behavior, loading conditions, and desired level of accuracy.
High Cycle Fatigue (HCF) – Stress-Life Approach
The stress-life approach, based on S-N curves, is widely used for components expected to endure a large number of cycles (e.g., millions). It assumes that fatigue life is primarily governed by elastic stress amplitude. It’s often applied to rotating machinery, pressure vessels, and structural components subjected to vibration.
- Applicability: High cycle, elastic stress states, long lives.
- Key Challenge: Accurately determining the stress amplitude at critical locations, especially considering stress concentrations.
Low Cycle Fatigue (LCF) – Strain-Life Approach
The strain-life approach is employed when localized plastic deformation is expected, leading to shorter fatigue lives. This is common in thermal cycling, start-stop operations, or areas with high stress concentrations causing local yielding. E-N curves capture both elastic and plastic strain components.
- Applicability: Low cycle, significant plastic deformation, shorter lives.
- Key Challenge: Requires accurate measurement or prediction of local strain, which can be complex with FEA.
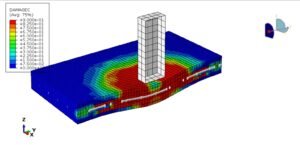
Linear Elastic Fracture Mechanics (LEFM) – Crack Growth Approach
LEFM is used to predict the growth of an existing crack under cyclic loading. This approach focuses on the stress intensity factor range (ΔK) at the crack tip and its relation to the crack growth rate (da/dN), typically described by Paris’ Law. It’s vital for assessing damaged structures and conducting FFS evaluations.
- Applicability: Components with detectable cracks, predicting remaining useful life.
- Key Challenge: Requires precise knowledge of initial crack size, geometry, and loading.
Practical Workflow for Fatigue Life Prediction using FEA
Integrating fatigue analysis into a modern CAD-CAE workflow streamlines the process significantly. Here’s a typical step-by-step guide, often performed with tools like Abaqus or ANSYS Mechanical:
1. Material Characterization
Gather reliable material properties, specifically fatigue data (S-N or E-N curves), elastic modulus, yield strength, and tensile strength. Ensure the data is relevant to the operating temperature and environment.
2. Geometry Definition & Meshing
- CAD Model: Start with an accurate 3D CAD model. Simplify features that don’t affect critical stress areas (e.g., small chamfers far from high stress).
- Meshing: Create a fine, high-quality mesh in critical regions where fatigue is expected (e.g., fillets, holes, weld toes). Use tetrahedral or hexahedral elements. Convergence studies are essential here.
3. Loading & Boundary Conditions
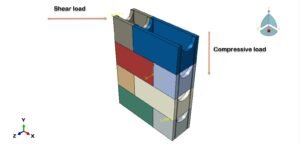
- Cyclic Loads: Define the type of cyclic loading (e.g., fully reversed, pulsating, random). Accurately represent the magnitude, frequency, and sequence of loads.
- Boundary Conditions (BCs): Apply realistic constraints to prevent rigid body motion and accurately represent how the component is supported or attached in reality.
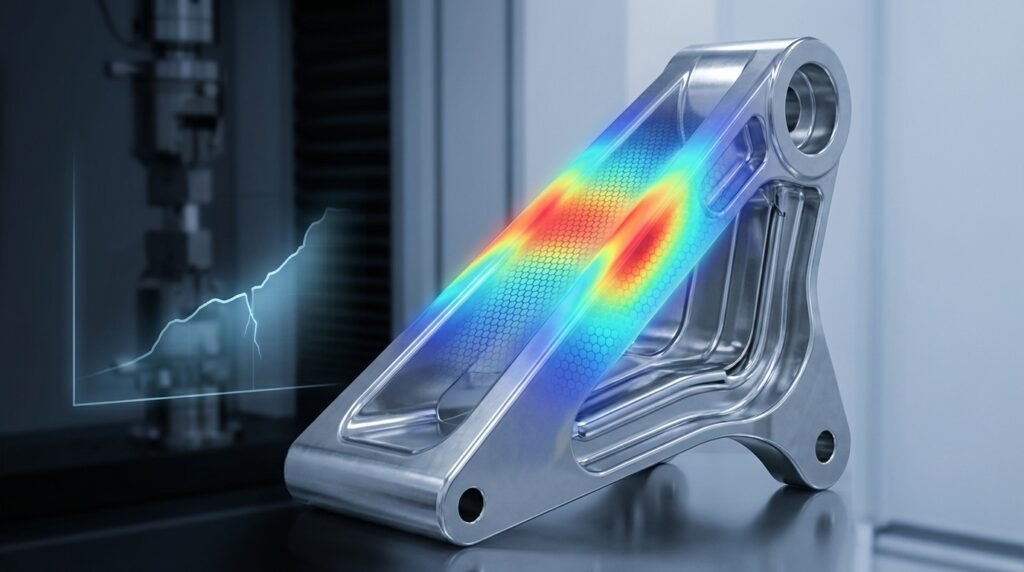
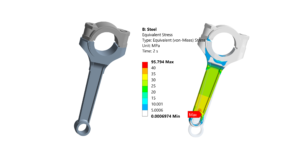
4. Static Structural Analysis
Perform a preliminary static structural analysis under peak loads to identify critical stress/strain locations. This helps validate the model setup and guides refinement for fatigue analysis.
5. Fatigue Analysis Setup
- Method Selection: Choose between S-N or E-N approach based on stress levels and expected life.
- Mean Stress Correction: Apply an appropriate mean stress correction theory (e.g., Goodman, Gerber, Soderberg) if the loading is not fully reversed.
- Fatigue Solver: Configure the fatigue solver within your FEA package (e.g., Abaqus/CAE’s ‘Fatigue’ module, ANSYS Mechanical’s ‘Fatigue Tool’). Input material fatigue properties and load history.
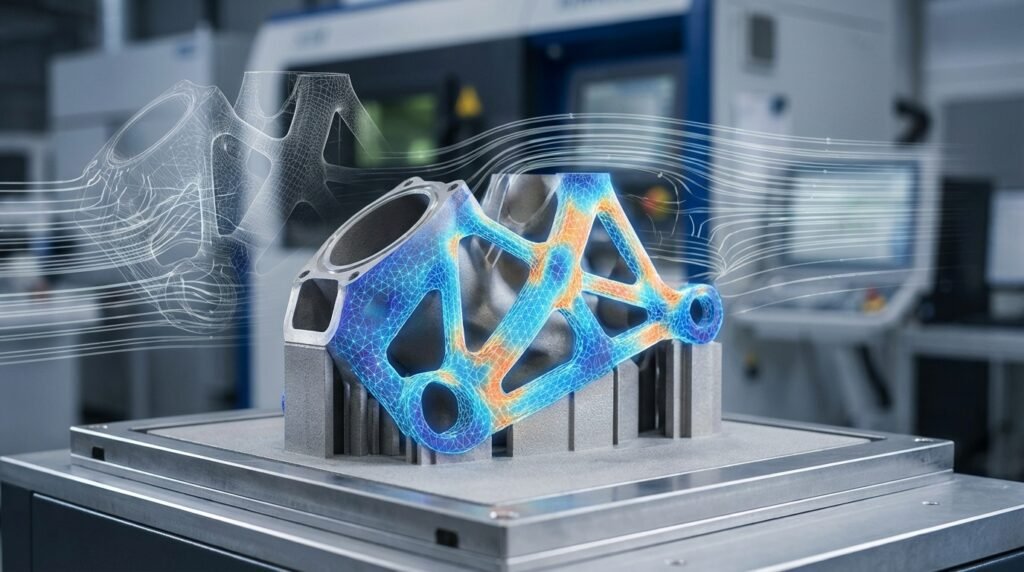
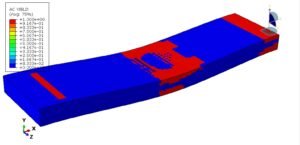
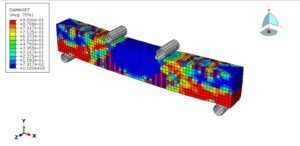
6. Post-processing & Interpretation
Visualize fatigue life, damage, and safety factor contours. Identify the lowest life regions. Analyze the results in conjunction with design requirements and safety factors.
Common Pitfalls in the Workflow
- Using generic material data instead of actual test data for the specific material and condition.
- Insufficient mesh refinement at stress concentration points, leading to inaccurate stress predictions.
- Incorrectly applying boundary conditions or load magnitudes.
- Ignoring mean stress effects in tensile-dominant loading.
- Extrapolating S-N curves far beyond the tested data range.
Verification & Sanity Checks for Fatigue Analysis
Ensuring the reliability of your fatigue prediction is as important as the analysis itself. Robust verification and validation steps are critical.
Mesh Sensitivity Analysis
Run the analysis with progressively finer meshes in critical areas. If the fatigue life results change significantly with mesh refinement, your mesh is too coarse. Aim for convergence where results stabilize.
Boundary Condition Checks
Review reaction forces and visualize deformation patterns. Do they make physical sense? Are there any unintended rigid body motions or excessively constrained regions?
Stress Concentration Verification
Compare your FEA-derived stress concentration factors (Kt) in simple geometries (e.g., a plate with a hole) against analytical or handbook solutions. This builds confidence in your model’s ability to capture localized stresses.
Convergence Criteria & Solution Stability
For non-linear analyses (e.g., involving plasticity for LCF), monitor convergence plots. Ensure the solution has converged robustly to avoid erroneous results.
Validation with Test Data or Hand Calculations
Whenever possible, compare your FEA fatigue life predictions against experimental data for similar components or against simplified hand calculations for basic load cases. This provides invaluable real-world validation.
Sensitivity Analysis
Vary key input parameters (e.g., material properties within their scatter bands, load magnitudes, surface finish parameters) to understand their impact on fatigue life. This helps identify the most influential factors and account for uncertainties.
Designing for Fatigue Resistance
Beyond analysis, design choices play a crucial role in fatigue performance:
- Material Selection: Choose materials with good fatigue properties (e.g., high endurance limits, better crack growth resistance).
- Geometric Optimization: Reduce stress concentrations by using generous fillet radii, avoiding sharp corners, and optimizing part geometry.
- Surface Treatments: Apply surface treatments like shot peening, case hardening, or nitriding to induce compressive residual stresses, thereby increasing fatigue life.
- Welding Practices: Design welds to minimize stress concentrations and apply post-weld treatments to improve fatigue strength.
For complex fatigue analyses or when needing to run large models efficiently, EngineeringDownloads.com provides affordable HPC rental services, alongside specialized online courses and project consultancy to help you master these advanced engineering challenges.
Comparison of Mean Stress Correction Models
The choice of mean stress correction model can impact fatigue life prediction, especially for ductile materials under varying mean stresses. Here’s a brief comparison:
| Model | Description | Applicability | Key Assumption |
|---|---|---|---|
| Goodman | Linear relationship between stress amplitude and mean stress. | Conservative for ductile materials, HCF. | Linear degradation of stress amplitude with mean stress. |
| Gerber | Parabolic relationship between stress amplitude and mean stress. | Less conservative than Goodman, generally good for ductile materials. | Parabolic degradation, closer to experimental data for many materials. |
| Soderberg | Highly conservative linear relationship, based on yield strength. | Very conservative, suitable for brittle materials or high safety factor designs. | Yield strength is the limit for mean stress, highly safe. |
| ASME Elliptic | Elliptic relationship, often used in pressure vessel design codes. | General purpose, balances conservatism and accuracy. | Yield strength and ultimate strength define the envelope. |
Conclusion
Fatigue life prediction is a multifaceted and essential aspect of modern structural engineering. By mastering the fundamental concepts, understanding the available methodologies, and diligently following a robust FEA workflow with rigorous verification, engineers can significantly enhance the reliability, safety, and lifespan of their designs. Continuous learning and practical application of these principles are key to preventing costly and potentially catastrophic fatigue failures.
Further Reading
For more detailed information on cycle counting in fatigue analysis, refer to ASTM E1049.