Fatigue is a phenomenon that causes material degradation and eventual failure under cyclic loading, even when the applied stresses are well below the material’s yield strength. It’s a silent killer of structures, responsible for a significant percentage of in-service failures across industries from aerospace to oil & gas. For engineers, accurately predicting fatigue life is not just good practice; it’s critical for ensuring structural integrity, safety, and long-term durability of components and systems.
Modern engineering relies heavily on advanced simulation techniques to understand and predict complex behaviors. Finite Element Analysis (FEA) has emerged as an indispensable tool in this regard, offering powerful capabilities to analyze stress and strain distributions under various loading conditions. When coupled with robust fatigue assessment methodologies, FEA enables engineers to design components that can withstand millions of load cycles without failing, pushing the boundaries of what’s possible in design and material utilization.

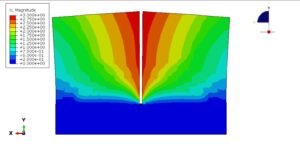
Image illustrating a typical Stress-Life (S-N) curve, crucial for fatigue analysis.
Understanding Fatigue: The Silent Killer of Structures
Before diving into the FEA specifics, it’s vital to grasp the fundamentals of fatigue. Unlike static failure, which occurs when a load exceeds a material’s strength, fatigue failure develops over time due to repeated loading cycles.
What is Fatigue?
Fatigue initiates as microscopic cracks at stress concentrators (e.g., notches, holes, surface imperfections). These cracks grow incrementally with each loading cycle until the remaining cross-section can no longer sustain the applied load, leading to sudden, brittle-like fracture.
- Cyclic Loading: The defining characteristic. Loads can be constant amplitude or variable, tensile or compressive, bending or torsional.
- Stress Concentrators: These are critical sites for crack initiation. FEA is excellent at identifying and quantifying stresses at these locations.
- Progressive Damage: Fatigue is a cumulative damage process. Each cycle contributes to the growth of existing cracks or the initiation of new ones.
- Absence of Warning: Fatigue failures often occur without gross plastic deformation, making them particularly dangerous if not predicted.
Why is Fatigue Life Prediction Critical?
The consequences of fatigue failure can range from costly repairs and operational downtime to catastrophic loss of life and environmental damage. Accurate prediction ensures:
- Safety: Preventing unexpected failures in critical components like aircraft wings, bridge structures, pressure vessels, and rotating machinery.
- Reliability: Ensuring products meet their intended service life, reducing warranty claims and enhancing brand reputation.
- Cost Efficiency: Optimizing material usage and design without over-engineering, leading to lighter and more economical structures.
- Compliance: Meeting stringent industry standards and regulatory requirements (e.g., FFS Level 3 for structural integrity assessments in oil & gas).
The Role of FEA in Fatigue Analysis
FEA provides the detailed stress and strain information necessary to perform a robust fatigue assessment that hand calculations simply cannot achieve for complex geometries and loading.
Why FEA is Indispensable
FEA simulates how a structure behaves under applied loads, providing detailed maps of stress, strain, and displacement. For fatigue analysis, this means:
- Pinpointing Stress Concentrations: Accurately identifying ‘hot spots’ where fatigue cracks are most likely to initiate.
- Handling Complex Geometries: Analyzing intricate shapes and assemblies that are impossible to evaluate analytically.
- Simulating Complex Loadings: Applying realistic load histories, including variable amplitude, multiaxial, and thermal loads.
- Virtual Prototyping: Testing design iterations virtually, reducing the need for expensive physical prototypes and accelerating the design cycle.
FEA Fatigue Analysis Methods
Several established methodologies integrate FEA results for fatigue life prediction:
Stress-Life (S-N) Approach
The S-N approach is the most common method, especially for components subjected to high-cycle fatigue (HCF), where stresses are primarily elastic. It correlates the applied stress amplitude with the number of cycles to failure (N).
- Mechanism: Primarily focuses on crack initiation, assuming crack propagation is rapid after initiation.
- Input Data: Requires S-N curves, which are typically derived from experimental testing of smooth specimens.
- Pros: Simpler, widely applicable for HCF, good for basic screening and design.
- Cons: Limited accuracy for low-cycle fatigue (LCF) where plastic deformation occurs, sensitive to mean stress effects.
Strain-Life (E-N) Approach
The E-N approach is more suitable for low-cycle fatigue (LCF) applications where localized plastic deformation occurs. It correlates total strain amplitude (elastic + plastic) with the number of cycles to failure.
- Mechanism: Accounts for both elastic and plastic deformation, making it ideal for LCF and situations with high stress concentrations.
- Input Data: Requires E-N curves and cyclic stress-strain properties of the material.
- Pros: More accurate for LCF, better at handling plastic deformation and stress concentration effects.
- Cons: Requires more complex material characterization, computationally more intensive.
Fracture Mechanics Approach (Crack Growth)
While not strictly a fatigue life prediction method from initiation, fracture mechanics is crucial for predicting the remaining life of a component once a crack has initiated or been detected. It focuses on crack growth rates (da/dN) based on stress intensity factors (K).
- Mechanism: Predicts how an existing crack will propagate under cyclic loading until critical size is reached.
- Input Data: Requires da/dN vs. delta K curves (Paris Law coefficients).
- Applications: Damage tolerance design, Fitness for Service (FFS) assessments (e.g., API 579 / ASME FFS-1 Level 3), remaining life assessment.
Practical Workflow for Fatigue Life Prediction using FEA
A systematic approach is key to reliable fatigue life prediction. Here’s a practical workflow:
Step 1: Material Characterization
The foundation of any fatigue analysis is accurate material data. You’ll need:
- Static Properties: Yield strength, ultimate tensile strength, Young’s Modulus, Poisson’s ratio.
- Fatigue Properties: S-N curves (for HCF) or E-N curves and cyclic stress-strain curves (for LCF). These should ideally be obtained from testing relevant material conditions (e.g., surface finish, heat treatment).
- Mean Stress Correction Data: Goodman, Soderberg, Gerber, or similar parameters to account for the effect of mean stress on fatigue life.
Step 2: Geometry and Mesh Generation
Import your CAD model into your FEA software (e.g., Abaqus, ANSYS Mechanical). Mesh quality is paramount, especially at stress concentration regions.
- Detailing: Simplify non-critical features but retain fillets, holes, and sharp corners as these are primary crack initiation sites.
- Mesh Density: Use a finer mesh in areas of high-stress gradients and expected fatigue initiation. A coarser mesh can be used in regions with uniform stress.
- Element Type: Use quadratic elements (e.g., PLANE183, SOLID186 in ANSYS, C3D8R in Abaqus) for better stress approximation than linear elements.
- Mesh Convergence: Ensure your mesh is fine enough to capture accurate stresses. This will be revisited in verification.
Example: For critical regions, consider structured hex meshes or fine tetrahedral meshes with inflation layers near surfaces.
Step 3: Load and Boundary Condition Definition
Apply realistic cyclic loads and boundary conditions that represent the component’s operational environment.
- Loading Type: Define whether the load is force, pressure, displacement, or a combination.
- Cyclic Definition: Specify the load cycle (e.g., fully reversed, pulsating, random variable amplitude). Define maximum and minimum loads, or load ratios (R = min load / max load).
- Boundary Conditions (BCs): Accurately constrain the model to prevent rigid body motion while allowing realistic deformation. Avoid over-constraining.
- Temperature Effects: If operating temperature significantly affects material properties, include thermal loads or adjust material data accordingly.
Step 4: Static or Transient Structural Analysis
Perform the structural analysis to obtain the stress/strain response. For fatigue, you’ll typically need to extract the stress/strain tensors over at least one full load cycle or for representative load conditions.
- Static Analysis: Sufficient for constant amplitude loading or when a representative peak stress can be identified. Run multiple static sub-steps for different points in the load cycle.
- Transient Analysis: Necessary for time-varying, dynamic, or random loads. This generates a stress/strain history over time.
- Software: Use commercial FEA packages like Abaqus, ANSYS Mechanical, Nastran, or open-source options like OpenFOAM (though fatigue post-processing is typically external).
Step 5: Post-Processing for Fatigue Analysis
Once the structural analysis is complete, extract the relevant stress/strain results and feed them into a fatigue post-processor (either integrated into your FEA software or a dedicated tool).
- Stress Linearization: For pressure vessels and other structural components, linearize stresses through the thickness to separate membrane and bending components.
- Hot Spot Stress/Strain: Identify the maximum principal stress, Von Mises stress, or critical plane strains at potential failure locations.
- Fatigue Theories: Apply a suitable fatigue criterion. The choice depends on material behavior, loading type (uniaxial/multiaxial), and mean stress effects. Common theories include:
| Fatigue Theory | Application/Description | Key Assumption |
|---|---|---|
| Goodman Diagram | Common for brittle materials; conservative for ductile materials under tensile mean stress. Relates stress amplitude to mean stress. | Linear relationship between stress amplitude and mean stress. |
| Soderberg Diagram | Most conservative for all materials. Uses yield strength as the limiting factor for mean stress. | Failure occurs when stresses reach yield strength. |
| Gerber Parabola | Better fit for ductile materials, especially for tensile mean stresses. Less conservative than Goodman. | Parabolic relationship between stress amplitude and mean stress. |
| ASME Elliptic | Often used in pressure vessel design codes. Combines yield and ultimate strengths. | Elliptic relationship, good for ductile materials. |
| Fatemi-Socie (FS) | Multiaxial strain-life criterion for ductile materials, considering shear and normal strains on the critical plane. | Crack propagation on maximum shear strain plane. |
| Smith-Watson-Topper (SWT) | Multiaxial strain-life criterion for ductile materials, incorporating maximum normal stress on the critical plane. | Crack propagation on maximum tensile strain plane. |
Dedicated fatigue software (e.g., fe-safe, nCode DesignLife) can be integrated with FEA results to automate this step, applying various criteria and producing life contour plots.
Step 6: Life Prediction and Damage Calculation
Calculate the fatigue life (number of cycles to failure) or safety factor at each critical location. For variable amplitude loading, use cumulative damage rules.
- Miner’s Rule: The most common linear damage accumulation rule. Sums damage fractions from different load cycles (D = Σ(ni/Ni), where ni is actual cycles at stress level i, and Ni is cycles to failure at stress level i). Failure is predicted when D ≥ 1.
- Interpreting Results: Review life contour plots, identify areas with minimum life, and assess safety factors against design requirements.
Verification & Sanity Checks in Fatigue FEA
The accuracy of FEA results directly impacts the reliability of fatigue predictions. Always perform thorough verification.
Mesh Sensitivity Study
Vary the mesh density in critical regions and observe the change in stress/strain results. The mesh is sufficiently fine when further refinement leads to negligible changes in the results (e.g., less than 5% change in peak stress).
Boundary Condition Validation
Ensure that your boundary conditions accurately represent the real-world constraints and support conditions. Ask: ‘Is this how the part is actually fixed or loaded?’
Load Case Verification
Compare simplified load cases with analytical solutions or previous designs. For example, calculate stress in a simple beam or plate under a known load and compare it to the FEA result. Even basic hand calculations can catch major errors.
Material Data Accuracy
Cross-reference material properties, especially fatigue curves, with authoritative sources like MIL-HDBK-5, ASM Handbook, or original material certifications. Be wary of generic database values; specific heat treatments and manufacturing processes can significantly alter fatigue performance.
Convergence Criteria
For non-linear analyses, ensure the solution has converged properly. Most FEA software provides metrics for convergence (e.g., energy, force residuals). A non-converged solution is meaningless.
Hot Spot Verification
Examine stress distributions around identified hot spots. Do they make engineering sense? Are they physically plausible? Sometimes, extremely high stresses are due to modeling singularities (e.g., sharp corners without fillets) rather than actual physical behavior.
Common Pitfalls and How to Avoid Them
- Inaccurate Material Data: Using generic S-N curves not representative of the actual material, surface finish, or manufacturing process. Always seek specific, validated data.
- Poor Mesh Quality at Stress Concentrations: Insufficiently fine mesh or poorly shaped elements in areas of high-stress gradients will lead to inaccurate stress predictions and thus incorrect life estimations.
- Incorrect Load Cycle Definition: Misrepresenting the load amplitude, mean stress, or sequence of loads can drastically alter the predicted life.
- Ignoring Mean Stress Effects: Neglecting to account for the impact of mean stress (e.g., using an S-N curve generated under fully reversed loading for a pulsating load) can lead to non-conservative predictions.
- Using an Inappropriate Fatigue Theory: Applying an S-N approach for LCF applications or using a criterion not suitable for multiaxial loading.
- Over-Reliance on Software Defaults: Blindly accepting default settings in fatigue modules without understanding their underlying assumptions.
- Neglecting Surface Finish Effects: Surface condition (e.g., machined, polished, shot-peened, corroded) significantly impacts fatigue strength. This needs to be factored into material data or via appropriate correction factors.
Leveraging Python & MATLAB for Enhanced Fatigue Analysis
For advanced or highly repetitive fatigue analyses, scripting languages like Python and MATLAB offer powerful capabilities to extend the functionality of commercial FEA software.
Automation of Post-Processing
Extracting specific stress/strain data from numerous nodes, performing cycle counting (e.g., Rainflow counting), and applying complex fatigue criteria can be automated.
# Example Python snippet for extracting nodal stresses from an FEA output file (concept)
import h5py # For Abaqus .odb files
import numpy as np

def extract_stress_at_nodes(odb_file, step_name, frame_index, node_set_name):
    # ... (code to open odb, get step, frame, and node data)
    return nodal_stresses

# Further scripts could apply Miner's rule or Rainflow counting
Custom Fatigue Algorithms
When standard fatigue theories aren’t sufficient, you can implement custom algorithms, probabilistic fatigue models, or incorporate proprietary material degradation models using these tools.
Data Management and Visualization
Python’s Matplotlib or MATLAB’s plotting functions allow for highly customized visualization of fatigue results, such as creating contour plots of life, safety factor maps, or interactive S-N curve viewers. They are also excellent for managing and analyzing large datasets from parametric studies.
For engineers seeking to master these techniques or requiring tailored solutions, EngineeringDownloads.com provides comprehensive tutoring services and downloadable project templates, including advanced Python and MATLAB scripts for fatigue post-processing.
Advanced Considerations
Beyond the basics, several factors can influence fatigue life prediction:
Multiaxial Fatigue
When components are subjected to complex loading that creates varying stress states (not just uniaxial), multiaxial fatigue criteria (e.g., Fatemi-Socie, Smith-Watson-Topper) become necessary. These account for the critical plane where fatigue damage accumulates.
Variable Amplitude Loading
Real-world loads are rarely constant. Variable amplitude loading requires specialized techniques like Rainflow cycle counting to transform a complex load history into a series of equivalent constant amplitude cycles, which are then used with cumulative damage rules.
Environmental Factors (Corrosion Fatigue)
Corrosive environments can drastically reduce fatigue life. This requires specific fatigue data generated in those environments or the application of appropriate degradation factors.
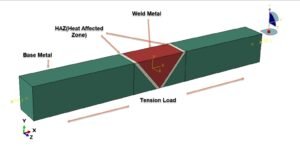
Welding and Surface Finish Effects
Welds introduce residual stresses, geometric discontinuities, and heat-affected zones, significantly impacting fatigue performance. Specialized fatigue assessment methods for welds (e.g., structural stress, notch stress, effective notch stress) are crucial. Surface finish is also a major factor, with rougher surfaces generally exhibiting lower fatigue strength.
FFS Level 3 Integration
In industries like Oil & Gas, Fitness-for-Service (FFS) assessments, particularly Level 3, often require advanced FEA and fracture mechanics to evaluate the integrity of components with existing flaws or damage, including fatigue cracks. This involves detailed stress analysis, crack growth prediction, and remaining life assessment.
Conclusion: Building Durable Designs
Fatigue life prediction using FEA is a powerful, yet intricate, engineering discipline. It combines detailed structural analysis with material science and sophisticated damage accumulation theories. By following a rigorous workflow, performing thorough verification, and being mindful of common pitfalls, engineers can confidently design components that are safe, reliable, and durable, even under severe cyclic loading conditions. The judicious application of FEA not only prevents catastrophic failures but also optimizes material use and accelerates innovation in product development.
Further Reading
NAFEMS – International Association for the Engineering Modelling, Analysis and Simulation Community
FAQ: Frequently Asked Questions about Fatigue Life Prediction with FEA
Question: What’s the main difference between the Stress-Life (S-N) and Strain-Life (E-N) approaches in FEA fatigue analysis?
Answer: The S-N approach is primarily used for high-cycle fatigue (HCF) where stresses are elastic and focuses on crack initiation, correlating stress amplitude with cycles to failure. The E-N approach is for low-cycle fatigue (LCF) where plastic deformation occurs, correlating total strain amplitude (elastic + plastic) with cycles to failure, providing better accuracy when significant plasticity is present.
Question: How critical is mesh quality for accurate fatigue life prediction using FEA?
Answer: Mesh quality is extremely critical, especially at stress concentration points (e.g., fillets, holes). Inaccurate stress predictions due to coarse or poorly-shaped elements in these regions will directly lead to incorrect fatigue life estimations. A mesh sensitivity study is essential to ensure results are independent of mesh density.
Question: Can FEA predict crack initiation AND crack propagation in fatigue?
Answer: FEA, when used with S-N or E-N methods, primarily predicts the life to crack initiation. To predict crack propagation (growth of an existing crack), a fracture mechanics approach using FEA to calculate stress intensity factors (e.g., J-integral, contour integral methods) is employed, often coupled with Paris Law for crack growth rate.
Question: What is Miner’s Rule and when is it used in fatigue life prediction?
Answer: Miner’s Rule (also known as Miner’s cumulative damage rule) is a linear damage accumulation theory used to predict fatigue life under variable amplitude loading. It sums the damage fractions (ni/Ni) from different stress levels, where ni is the actual number of cycles experienced at stress level i, and Ni is the fatigue life at that stress level. Failure is predicted when the sum of these damage fractions equals or exceeds 1.
Question: How can I account for mean stress effects in my FEA fatigue analysis?
Answer: Mean stress significantly influences fatigue life. You can account for it by using mean stress correction theories such as Goodman, Soderberg, Gerber, or ASME Elliptic diagrams. These theories modify the fatigue strength based on the applied mean stress. Most fatigue analysis software includes these correction methods, requiring you to define the mean stress component from your FEA results.