
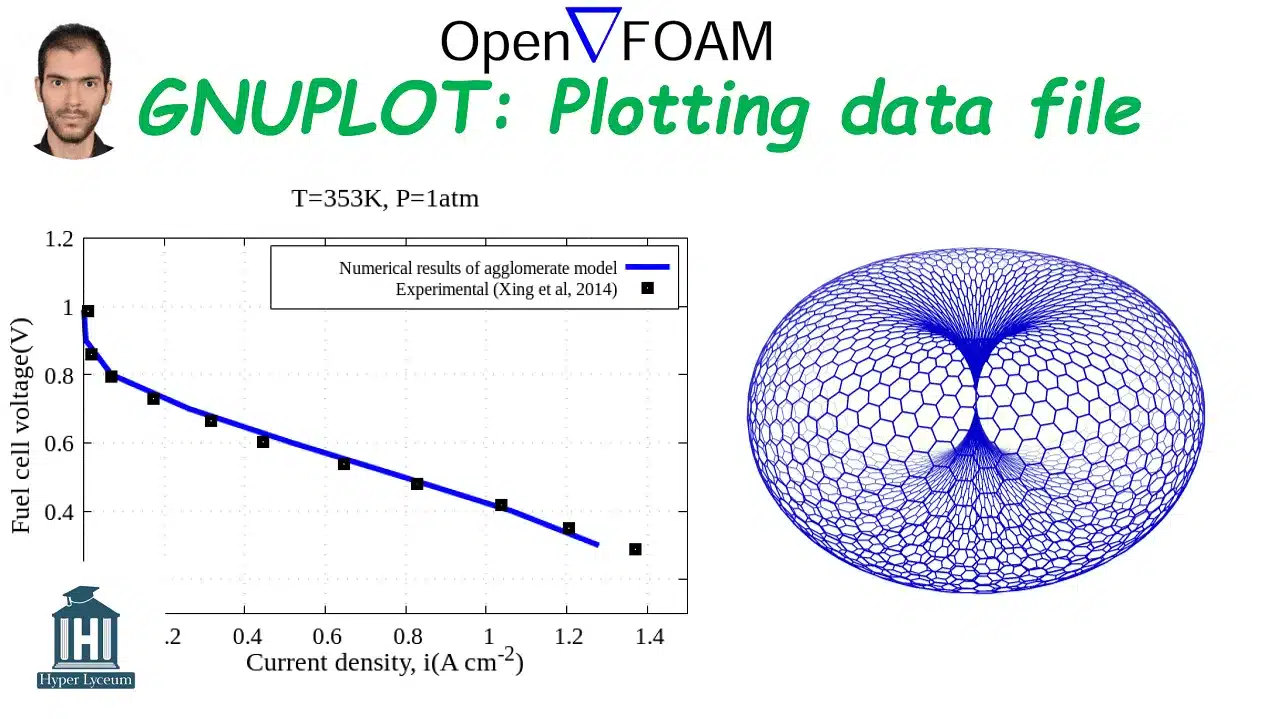

This tutorial introduces Gnuplot, a lightweight, open-source plotting tool used to visualize data and functions—ideal for scientific reports, CFD results, and experimental datasets. Whether you’re plotting data from simulations or measurements, Gnuplot allows for quick, customizable, and publication-ready graphs. This tutorial walks you through the basics of plotting data files and functions, with practical examples to get you started.
Perfect for students, engineers, and researchers who need simple yet powerful graphing without relying on heavyweight software.


Acoustic
€100,00 Original price was: €100,00.€99,99Current price is: €99,99.

Abaqus
€150,00 Original price was: €150,00.€120,00Current price is: €120,00.

Abaqus
€49,00 Original price was: €49,00.€29,00Current price is: €29,00.

Abaqus
€46,00 Original price was: €46,00.€26,00Current price is: €26,00.

Abaqus
€50,00 Original price was: €50,00.€30,00Current price is: €30,00.

Abaqus
€46,00 Original price was: €46,00.€27,00Current price is: €27,00.

Abaqus
€45,00 Original price was: €45,00.€28,00Current price is: €28,00.
See more

Let’s Learn and Collaborate
Get VIP access to new content.
Sign up for weekly deals and news.
Engineering Downloads is a hub for learning,
collaboration, and sharing engineering models
and resources.
© 2025 Engineering Downloads. All rights reserved.

Want to receive push notifications for all major on-site activities?


