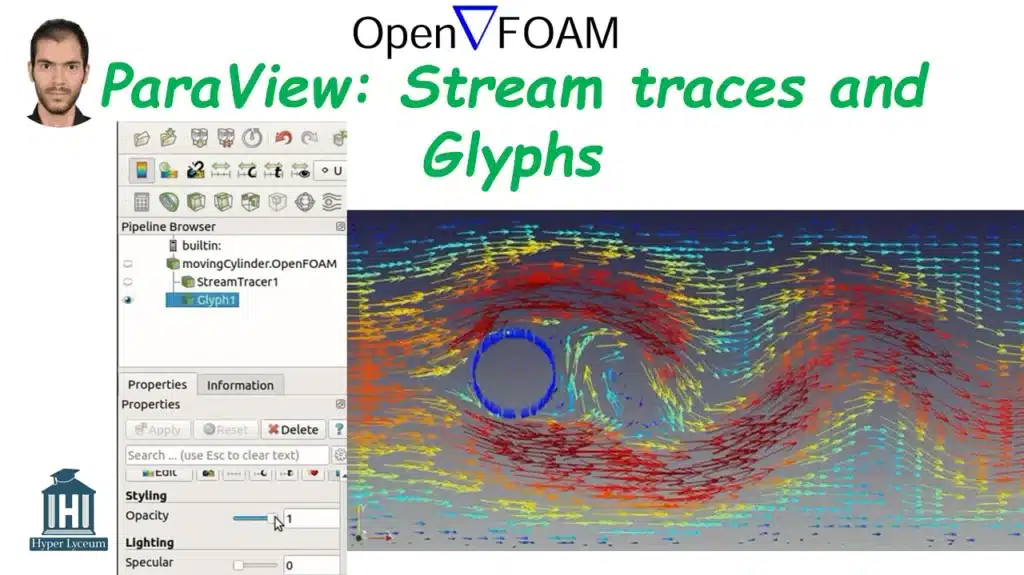

This tutorial shows you how to use ParaView, a powerful open-source visualization tool, to post-process CFD data from an OpenFOAM simulation of fluid flow over an oscillating cylinder. With a focus on effective visual communication of simulation results, you’ll explore essential ParaView filters such as Stream Traces and Glyphs to create insightful and visually compelling outputs.
Whether you’re preparing for presentations, publications, or deeper flow analysis, this tutorial will help you extract, visualize, and interpret fluid flow characteristics in a clear and professional way.


Acoustic
€100,00 Original price was: €100,00.€99,99Current price is: €99,99.

Abaqus
€150,00 Original price was: €150,00.€120,00Current price is: €120,00.

Abaqus
€49,00 Original price was: €49,00.€29,00Current price is: €29,00.

Abaqus
€46,00 Original price was: €46,00.€26,00Current price is: €26,00.

Abaqus
€50,00 Original price was: €50,00.€30,00Current price is: €30,00.

Abaqus
€46,00 Original price was: €46,00.€27,00Current price is: €27,00.

Abaqus
€45,00 Original price was: €45,00.€28,00Current price is: €28,00.
See more

Let’s Learn and Collaborate
Get VIP access to new content.
Sign up for weekly deals and news.
Engineering Downloads is a hub for learning,
collaboration, and sharing engineering models
and resources.
© 2025 Engineering Downloads. All rights reserved.

Want to receive push notifications for all major on-site activities?


